Table of Contents
The Code of Federal Regulations (Title 30, Chapter 1, Part 57, Section 57.5-1) requires that metal and nonmetal mines shall maintain a time weighted average (TWA) for total and respirable airborne dust concentrations below that established by the American Conference of Governmental Industrial Hygienists in 1973. This TWA for total dust concentrations must be under a TLV (threshold limit value) of 10 mg/m³ with less than 1 pct crystalline quartz content (free silica). Quartz content occasionally exceeds the 1-pct limit, and the modified TLV standard is then computed using the following equation:
TLV = 30 mg/m³/pct quartz + 3…………………………………………..(1)
In conventional room-and-pillar mining, the face drilling operation is frequently a severe source of airborne dust. Without the use of dust control techniques, instantaneous total dust concentrations occasionally reach and exceed 200 mg/m³, and the 8-hour TWA can exceed the TLV of 10 mg/m³ total dust. Two methods that have been tried by the mining industry to control the dust produced by face drilling are dry collection systems and wet dust suppression systems. Wet dust suppression includes external water sprays, through the drill-steel water injection, and through-the-drill-steel foam injection. Although there are no published data concerning the relative dust control effectiveness of the two methods in noncoal mining, it is generally accepted that dry collection systems are inferior to wet suppression systems, primarily because of the inability of dry collection systems to maintain inlet dust capture effectiveness. Since the overall dust reduction is a product of the inlet dust capture efficiency and dust collection efficiency, high collection efficiency is pointless unless the inlet dust capture efficiency is likewise very high.
In wet dust suppression systems, water and foam have had numerous applications in both coal and noncoal mining, such as belt transfer points, continuous miners, and undercutter machines and drills. A comparison of available data on the effectiveness of water and/or foam for dust control shows that dust reduction values can range from 0 pct to greater than 90 pct. Although water and water sprays are widely used for dust control, foam has generally been considered to have limited applicability. The factors governing the effectiveness of water sprays and other forms of wet dust suppression are (1) the proximity of the dust suppressant to the dust source and (2) the degree of isolation from dust-dispersing forces.
The objective of this study was to evaluate the use of foam as a dust control technique as determined by its use in face drilling and crushing operations.
Experimental Procedure
All dust concentration measurements were made by a GCA Real-Time Aerosol Monitor (RAM-I), without the use of a cyclone particle preclassifier. Without the preclassifier, the upper limit of the RAM-I’s particle-size detection is approximately 20 micrometers (µm). Although this is not a “true” measurement of total dust concentration, it is more representative of the “actual” total dust concentration than that obtained with the preclassifier. This assumption was made for two reasons. First, face drilling operations are typically severe sources of dust with the majority of dust particles being nonrespirable that is, 7 µm or greater. Thus, relative efficiency values for nonrespirable particles may differ from those for respirable particles. (See appendix B for calculation of efficiencies.) Second, the mine in which this study was made is sampled for total dust concentrations by the Mine Safety and Health Administration (MSHA); therefore, the data must show the results in a manner relevant to MSHA enforcement criteria.
The measurement technique involved short-term (less than 90 rain) measurements of dust concentrations for consecutive periods with and without foam. Sampling in this fashion of measuring dust concentrations helps guarantee that the resulting dust reductions are a function only of the application of foam; many variables such as humidity, local ventilation, machine operation rate, and entry size will not change appreciably during the short-term measurements.
Because of the measurement technique, only relative dust concentration values were needed to determine the effectiveness of the foam (appendix B). Therefore, calibration of the RAM-I for the ore dust (anhydrite and gypsum with gray and red shale) was not necessary.
The analog output of the RAM-I was continuously recorded by a portable strip-chart recorder for “hard-copy” data analysis.
Face Drill
Figure 1 shows the ventilation and sampling plan for the two faces studied. A series of blastholes was drilled into each face in roughly a radial fan pattern using a rotary percussion drill. The time needed to drill an entire face was approximately 90 min, which was divided into two 45-min segments. The foam was applied to the face through the drill steel for the first 45 min (foam on), and then discontinued for the second 45-min (foam off). See appendix A for a complete description of the foam-generation system.
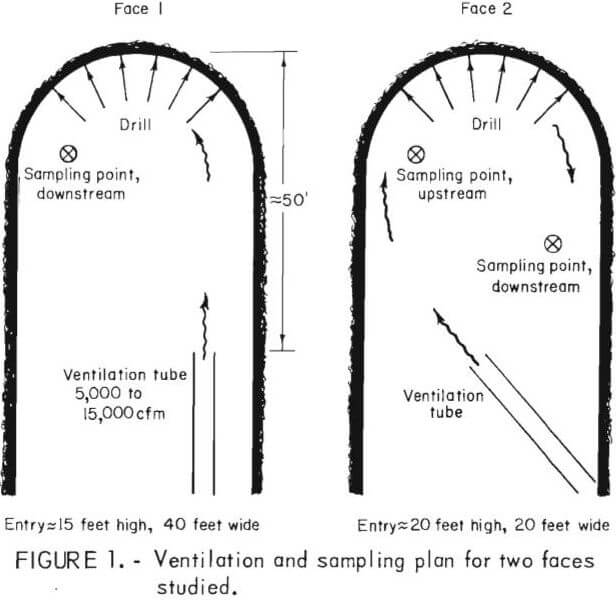 Blowing ventilation was supplied to both entries at a distance of approximately 50 feet from the face. A 20,000-cfm auxiliary fan located 1,100 feet from the entries provided split ventilation to both entries through 30-inch-diameter, flexible ducting. Because of duct length, leaks, and various pressure losses, the amount of air delivered to each heading was between 5,000 and 15,000 cfm.
Entry 1 had the blowing ventilation directed along the right rib toward a 15-foot-high by 40-foot-wide face. The RAM-I was located on the left-rib (or downstream side) of the driller.
Entry 2 had the blowing ventilation directed diagonally from the right rib to the left rib toward a 20-foot-high by 20-foot-wide face. In order to evaluate the effect of the blowing ventilation on the dust sampling, the RAM-I was located consecutively on both the upstream and downstream sides of the driller.
Crusher
Dust sampling on the crusher was performed at two locations, the operator’s position and a location of suspected high dust concentration on a walkway midpoint between the operator and the crusher. At each location the RAM-I monitored the dust concentrations present during the foam-on and foam-off conditions for each of two feeders. These feeders alternately fed the crusher.
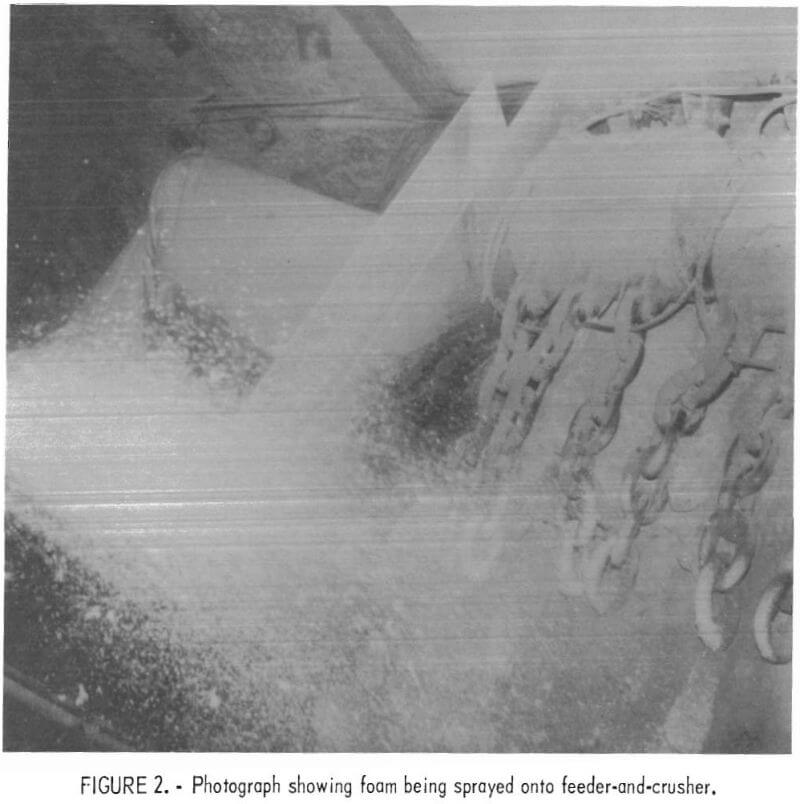
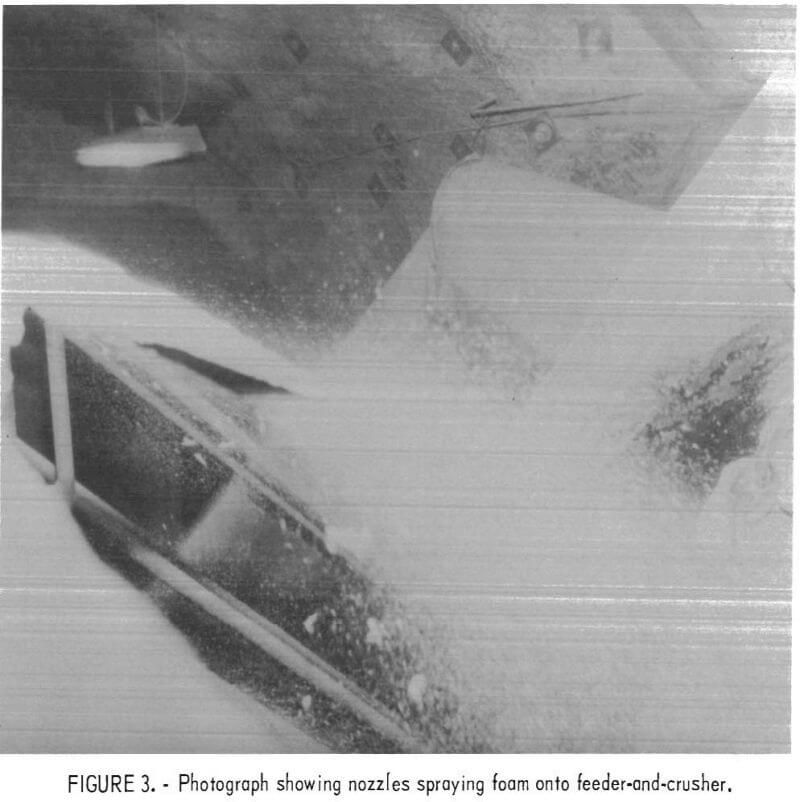
Figures 2 and 3 are photographs of one feeder (as seen from the operator’s position) being sprayed with foam prior to dumping ore into the crusher. Another identical feeder was located to the rear of the photographer.
Results
Face Drill
Table 1 lists the sampling results obtained during the drilling of two faces. For face 1, foam injection through the drill steel was 96-pct efficient on the downstream-ventilation side of the drill. During drilling without foam, the total dust concentration was 207.7 cu (arbitrary concentration units; see appendix B). Drilling with foam produced a total dust concentration of 8.9 cu, which should be compared to the total background dust concentration of 5.3 cu before drilling began.

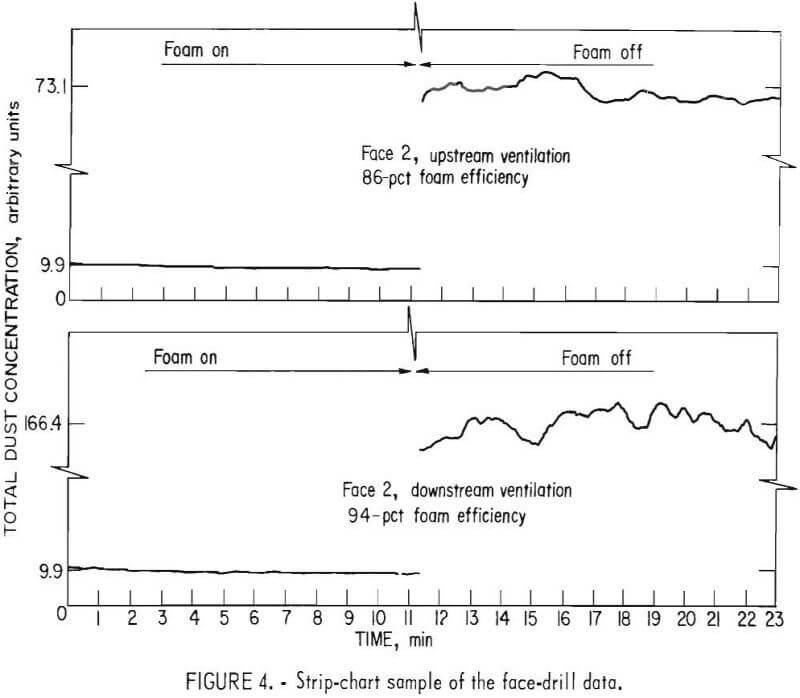
Total dust concentrations for face 2 were obtained at two locations, upstream and downstream of the drill with and without the use of foam. On the upstream-ventilation side, the foam efficiency was 86 pct; the efficiency on the downstream-ventilation side was 94 pct. A representative sample of the strip-chart-recorder data is given in figure 4.
Crusher
Table 2 presents the dust concentrations recorded for both feeders at two locations, the operator’s position and a position between the crusher and the operator’s position.

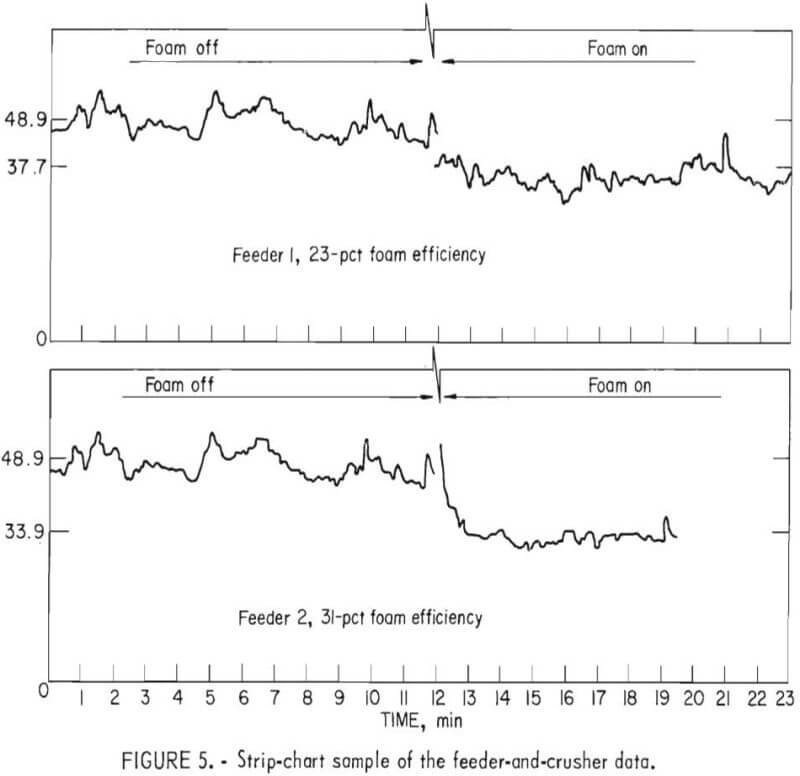
At the operator’s position of each feeder, the use of foam produced 0-pct efficiency, which in itself did not result from foam ineffectiveness. During sampling at the operator’s position, it was determined that this was not a representative sampling location. The operator was on the upstream-ventilation side of the feeder-and-crusher, and was therefore not exposed to the dust produced by the feeder-and-crusher. Thus, the effects of the foam could not be demonstrated at this location. The RAM-I was then moved to a location between the crusher and the operator on the downstream-ventilation side. As shown in table 2, foam efficiencies obtained for feeders 1 and 2 were 23 and 31 pct, respectively, at the new sampling location.
Figure 5 compares representative samples of the strip-chart data recorded during the testing.
Discussion and Conclusions
The results obtained from this study indicate that, depending upon the application, foam may be an excellent dust control technique. For example, face drilling is an exceptionally dusty operation, and efficiencies for sustained dust capture and collection have generally proved to be marginal at best. However, application of the foam through the drill steel resulted in a clean operation.
Comparison of the upstream and downstream foam efficiencies for face 2 (table 1) show that the existing face ventilation was only minimally effective, as indicated by the 8-pct difference between the upstream and downstream foam efficiences.
In a totally different application, the foam was applied to the feeder- and crusher unit. The results show that the foam was not nearly as efficient on the crusher (27-pct average) as it was on the face drill (95-pct average).
The data in table 2 show an 8-pct difference in foam efficiencies between the two feeders. Since both feeders were identical, the corresponding difference can be attributed to two factors. First, the foam dust control system was dispensing more foam directly onto feeder 2 than onto feeder 1. Second, local ventilation variations between feeders 1 and 2 could affect the dust dispersion at each feeder, causing differences between the foam efficiencies for each feeder.
The conclusions obtained from this study are as follows:
- Foam can be an extremely effective dust control technique when used on localized dust sources such as dust generated within a blasthole during drilling.
- Foam is only marginally effective as a dust control technique when used on nonlocalized dust sources such as dust generated during the feeder and crusher operation.
One important point should be mentioned. The application of foam through the drill steel is a very localized application; that is, within a 2-inch- diameter hole at the point of generation. On the other hand, application of foam to the feeder-and-crusher unit involves a wide area dispersion to a number of locations along the ore flow line. It was apparent during the study that a more judicious location for the nozzles could be chosen to achieve more effective dust control at the crusher, although the foam as applied to the crusher did provide some dust reduction.
Description of Foam Generator
Figure A-1 shows the foam generation system fabricated and used by the Locust Cove Mine on its rotary-percussion face drills and crusher. The foam generator consists of a 50-gal tank filled to within 2 inches of the top with 200 parts water to 1 part foam additive.
An air source operating at between 60 and 120 psi is split into two lines. Split 1 is fed directly into the tank to provide positive pressure within the tank, thus forcing the water-and-foam mixture out of the tank through a discharge tube. This discharge is subsequently mixed with the airstream in split 2 of the airline and delivered to the foam outlet.

For application on the face drill, the foam is forced directly through the hollow drill steel and into the blasthole at a liquid flow rate of approximately 0.6 gpm. As the foam mixes with the blasthole dust, positive pressure forces it out of the blasthole as a thick slurry. This slurry dries completely in a matter of hours.
The foam is applied to the crusher operation through 1/32-inch-by-2-inch, flat nozzles. The foam is applied to the ore via three nozzles as the ore passes through the feeder. There are three nozzles attached to each of two feeders that alternate operation. There is an additional nozzle spraying foam directly onto the crusher from approximately 10 feet above the crusher.
For each operation, the amount of foam used is regulated by numerous control valves, which are periodically adjusted by the operators to compensate for variable dust levels and for fluctuations of the foam generator.
Appendix B.—Data Analysis
All efficiencies were computed in terms of relative dust concentrations as measured with the Real-Time Aerosol Monitor (RAM-I). Referring to figures 4 and 5, the total dust concentrations for each period of foam on and foam off were obtained in two steps. First, the area under each curve, bounded by a common baseline, was determined by a compensating planimeter. Second, division of the obtained area by the corresponding time interval provided a dust concentration measured in arbitrary units, designated as concentration units (cu).
All efficiences were calculated from the following equation:

where C = the mean dust concentration at the stated condition, measured in arbitrary concentration units.
The error values presented in tables 1 and 2 are calculated by assuming a gravimetric-RAM correlation error of ±15 pct; that is, if the average concentrations determined by the RAM were converted to gravimetric averages, then the errors presented would be the associated gravimetric errors. Since a ±15-pct gravimetric RAM-correlation error does not specify the error to be in the RAM or gravimetric measurements, and because an absolute error of the RAM measurements is not known, the RAM measurements can be assumed to be accurate quantities in relation to one another.
