Table of Contents
The crushing plant simulator was utilized to evaluate the influence of major variables on the following responses: plant reduction ratio , weight % of -½ inch material in screen undersize, circulating load ratio and secondary screen efficiency. Variables manipulated were: weight % of +1 inch material in secondary crusher feed (73.3 to 92.9%), secondary crusher feed rate (1255 to 1578.8 STPH), secondary crusher close side set (2.54 to 3.785 cm), tertiary crusher close side set (.65 to 1.08 cm), and secondary screen opening (1.27 to 1.59 cm).
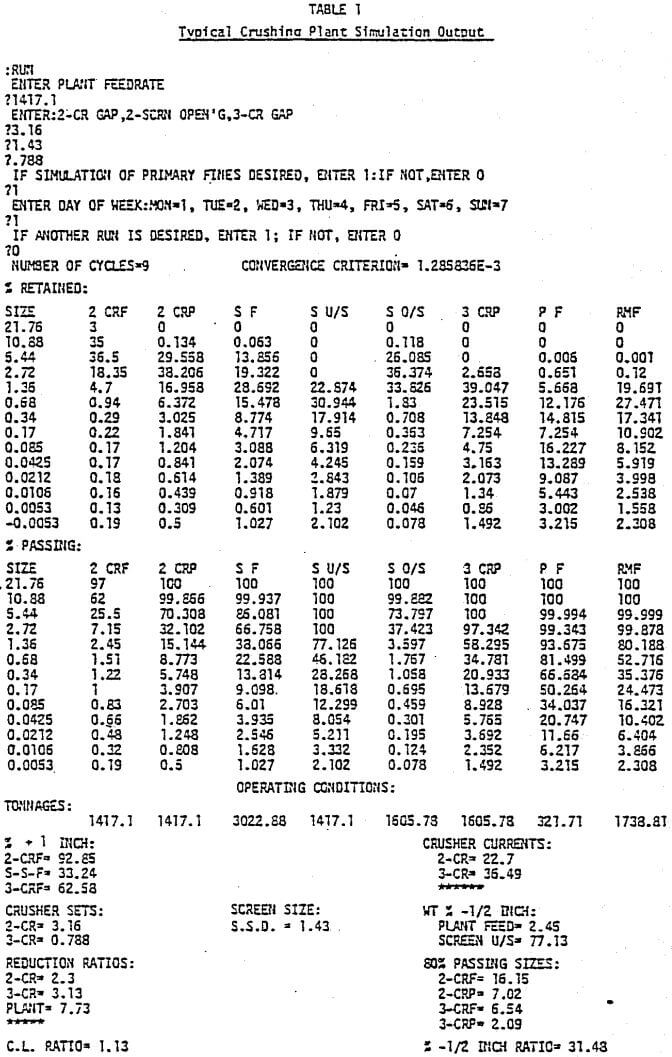
Unless stated otherwise, standard settings were: % +1 inch in secondary crusher feed = 83.6, secondary crusher close side set = 3.16 cm, secondary screen opening = 1.43 cm, tertiary crusher close side set = .788 cm and secondary crusher feed rate = 1417.1 STPH for two crushers. Output information(1) was obtained in accord with an experimental design.
The primary fines subroutine was deactivated for all computer output discussed in subsequent paragraphs. Effect of Secondary Crusher Feed Rate
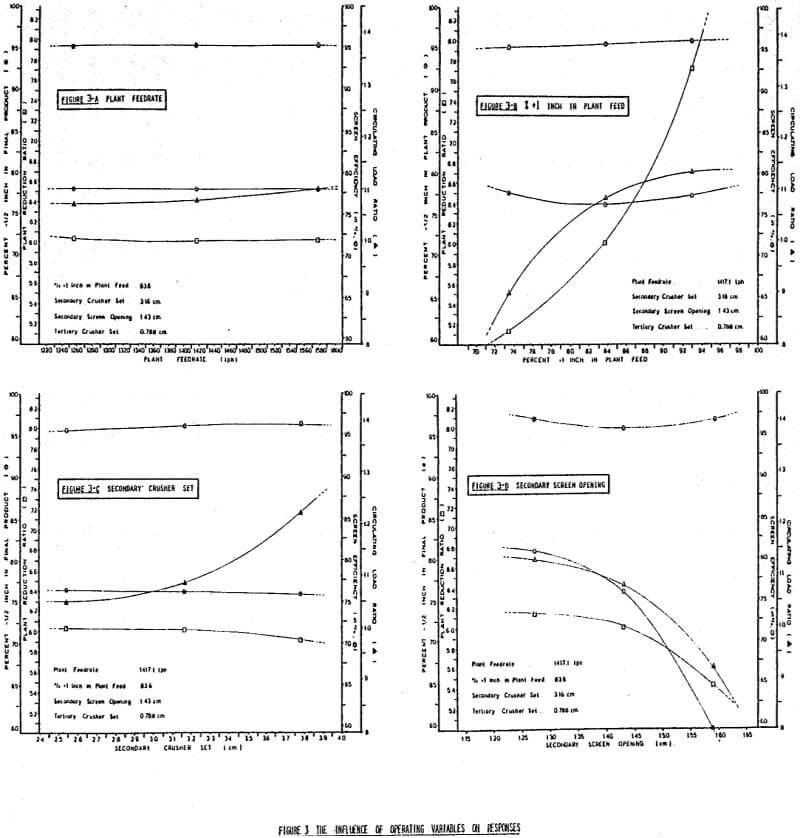
The influence of secondary crusher feed rate (i.e., feed to plant) on responses is shown in Figure 3-A. Standard settings were employed.
The reduction ratio, the screen efficiency , and the % -½ inch material in screen undersize are virtually independent of feed rate over the range investigated. On the other hand, at higher feed rates the curculating load increases slightly. This may be attributed to a crowding effect associated with higher feed rates to the secondary crusher. Secondary crusher product becomes coarser, so that the circulating load rises correspondingly.
Effect of % +1 Inch in Secondary Crusher Feed
Figure 3-B shows how the % +1 inch in plant feed will influence responses at standard settings. Note that the % -½ inch material in the screen undersize (final product) goes through a slight minimum. As might be expected, screen efficiency tends to increase a small amount at coarser feeds.
The plant reduction ratio and the circulating load ratio both increase as plant feed becomes coarser. This is not unreasonable. The crushers work harder on coarser feeds and will draw more power.
Coarsening the feed to the secondary crushers causes a decrease in the amount of fines discharged, so that the circulating load increases. The discharge rate of secondary crusher fines, at some point, becomes more or less constant and the circulating load levels off.
Effect of Secondary Crusher Close Side Set
At standard settings, the effect of an increase in secondary crusher close side set is depicted in Figure 3-C. The % -½ inch material in the screen undersize decreases slightly as the set increases. Plant reduction ratio decreases. Screen efficiency increases slightly, because the screen feed has coarsened. The circulating load ratio increases dramatically. As long as the tertiary crusher has not reached maximum capacity, the increase in circulating load does not profoundly influence fines production (screen undersize).
Effect of Secondary Screen Opening
Figure 3-D shows the effect of an increase in secondary screen opening on responses at standard settings. Screen efficiency goes through a very slight minimum, an effect that may be associated with the proportion of “near mesh” material produced by the crushers. In contrast, the % -½ inch material in the screen undersize, the plant reduction ratio and the circulating load ratio decrease substantially. This is not unexpected.
Effect of Tertiary Crusher Close Side Set
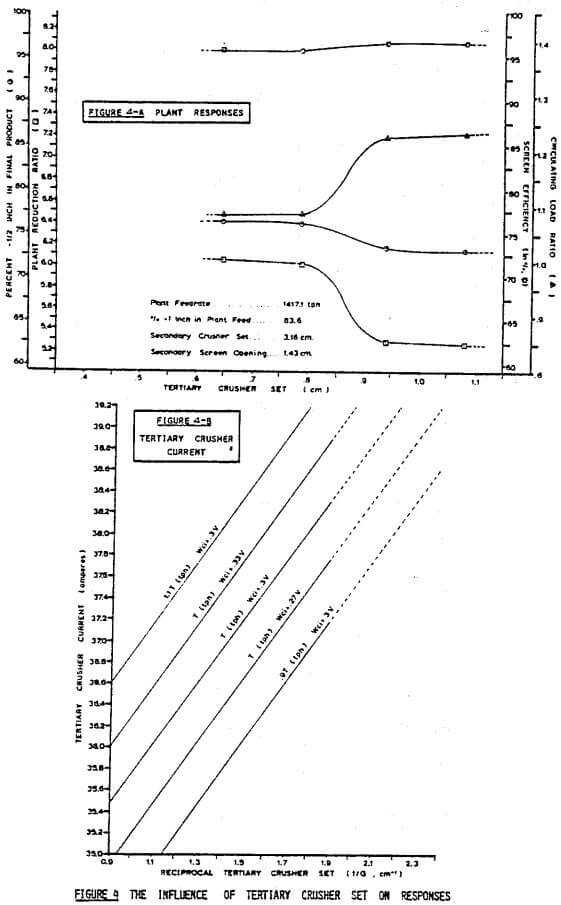
Figure 4-A shows how responses are influenced when the tertiary close side set is increased, other factors being held at standard settings.
Screen efficiency exhibits a very slight rise, while reduction ratio decreases from 6 to about 5.3 over the range investigated. The circulating load ratio tends to remain constant, then rises abruptly and levels off.
For smaller close side sets (less than about .6 cm), the simulator suggests that reduction ratios and circulating loads may fall off. Samples acquired in this region around the tertiary crusher are being checked and, if necessary, the model parameters will be re-evaluated.
Effect of Plant Variables on Crusher Currents
Figure 4-B shows how tertiary crusher feed rate, close side set and operating work index influence current draw. Somewhat similar effects are observed for the secondary crusher.
In Figure 4-B current draw is plotted against the reciprocal of the crusher set. If W ci is held
constant at 0.3 times V, where V is a multiplier, a 10% increase in W ci feed rate causes the current to increase by 1.2 amp. The effect of a 10% increase in W ci is not as large (current increases by about ½ amp).
Over the range of variation in W ci observed in the study, the simulator suggests that more horsepower should be installed if a finer product at higher tonnages is desired.
Summary and Conclusions
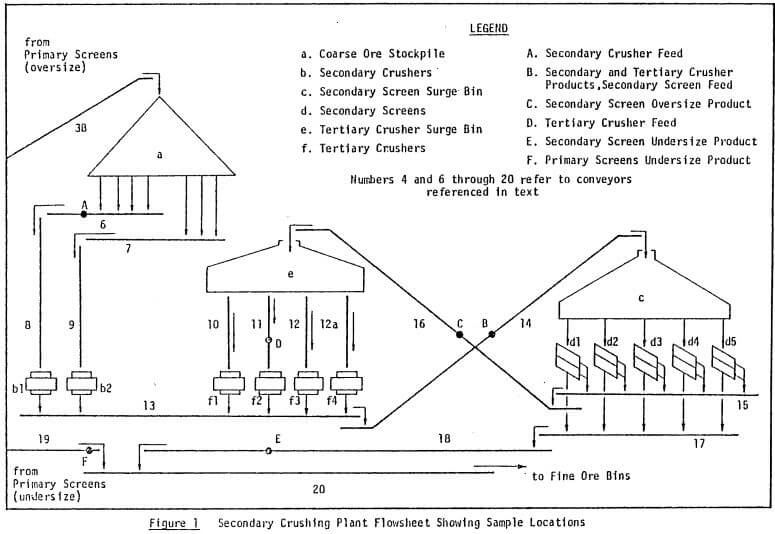
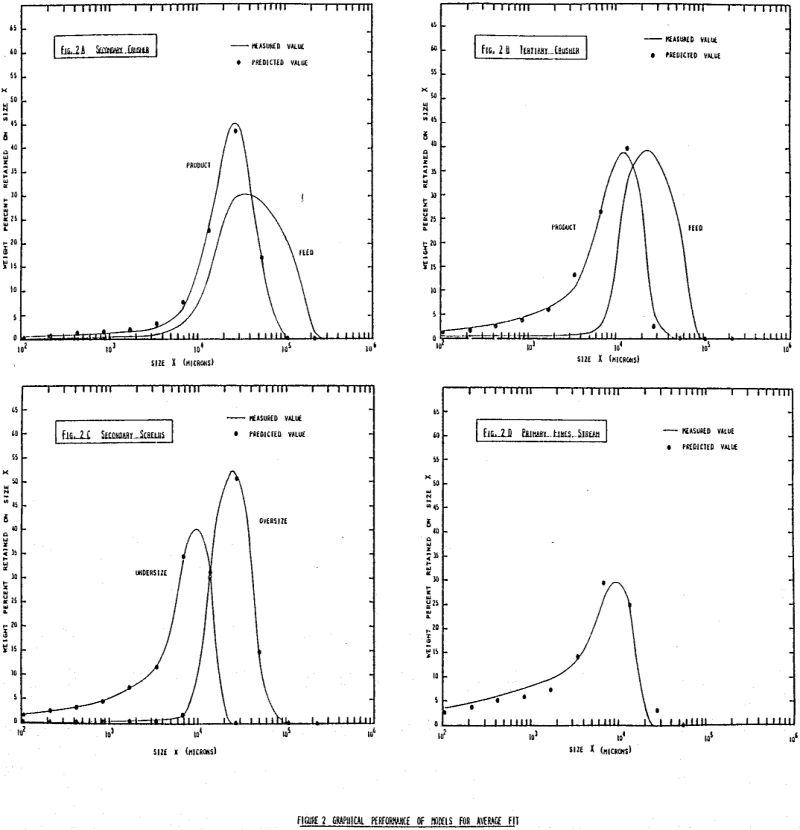
The methodology employed to simulate the Brenda Mines limited secondary crushing plant has been described. This includes selection of responses and independent variables, selection of mathematical models, acquisition of raw data, statistical adjustment of raw data, fitting models to data, assessing the adequacy of fitted functions and constructing a simulator for study.
Crusher product size distributions are predicted from empirical modifications of Equations 1 and 2. The secondary screen model:

with ci = 0, fitted statistically adjusted data exceptionally well.
In general, trends in simulator output are consistent with practice. For example, when screen efficiency is calculated as percent recovery to undersize and plotted against plant feed rate, a slight maximum is observed around 1420 STPH. Such effects have been observed by Flavel for various modes of operation. The current draw expressions (Equations 6 and 8) are consistent. Thus, at constant voltage, current is proportional to power. Hence Equations 6 and 8 show that power is directly proportional to crusher feed rate and inversely proportional to close side setting. This agrees with graphical observations by Flavel.
The simulator suggests that more horsepower installed on tertiary crushers may be beneficial, depending upon site objectives such as a finer crushing plant discharge. A similar conclusion was reached, independently and in a different manner, by Burkhardt.
Although trends appear to be consistent, alternative crusher models are being explored to avoid the complexity of those described in the APPENDIX. Current efforts are directed towards the development of more general crusher/screen models, since those herein reported are specific to the Brenda operation.
The Brenda crushing plant subroutines have been incorporated into a structure that will simulate the crushing and grinding circuits. The resulting simulator will serve as a subroutine for an offline optimization study to obtain an indication of the “best” crusher sets and screen opening for a given objective.
