Table of Contents
The object of refining copper in the reverberatory furnace is to obtain a metal which will have the highest attainable degree of malleability, ductility and electric conductivity, and present at the same time a level surface when it solidifies in the mold after casting. These desirable physical properties are governed by the character of the impurities and the forms in which they are present, by the amount of cuprous oxide retained by the copper, by the quantity of gas held in solid solution, by the casting-temperature, and by the thickness of the casting. The effects of impurities, of cuprous oxide and of gases upon the mechanical properties of copper have been studied by Hampe in his classical paper “ Contributions to the Metallurgy of Copper.” The most recent research into the effect of metals upon the electrical conductivity of copper is that of Addicks. The influence of cuprous oxide upon the electrical conductivity has been investigated by Walker and Addicks. The absorption of gases has received attention by Hampe, Stahl and Heyn. The effects of casting-temperature have been noted by Stahl.
The present paper contains the results of two lines of investigations embodying:
- a study of the physical and chemical changes undergone by two charges of electrolytic copper at different plants while being refined in the reverberatory furnace, and
- a study of overpoling electrolytic copper on eight tough-pitch and four furnace-overpoled samples from separate refineries.
The physical changes considered were in appearance of surface, specific gravity, tensile strength, elongation and electric conductivity. The modifications in fracture and microstructure have already been studied by Hofman, Green and Yerxa, and are therefore omitted. The chemical changes noted were confined to variations in the content of copper, iron, sulphur and oxygen, as the foreign substances contained in electrolytic copper are too small in amount to affect the present investigation. In the second part of the paper, the physical and chemical properties of samples of tough-pitch and of furnace-overpoled copper were studied; the tough-pitch samples were completely overpoled in crucibles and the ensuing properties of crucible-overpoled copper determined; lastly, crucible-overpoled copper was compared with native copper from Lake Superior.
Studies in Refining Electrolytic Copper
Refining-Charge No. 1
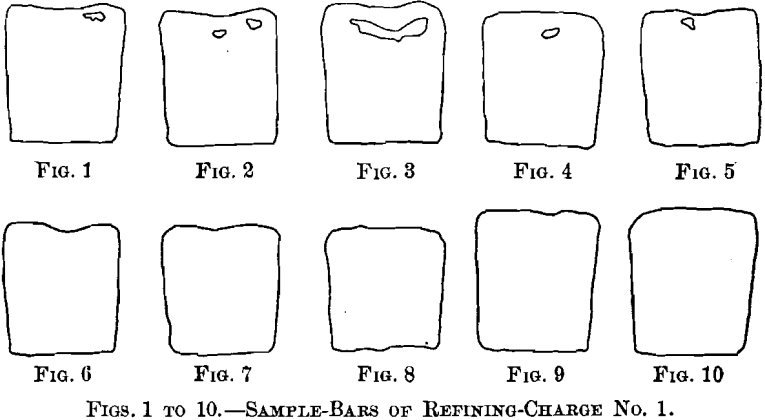
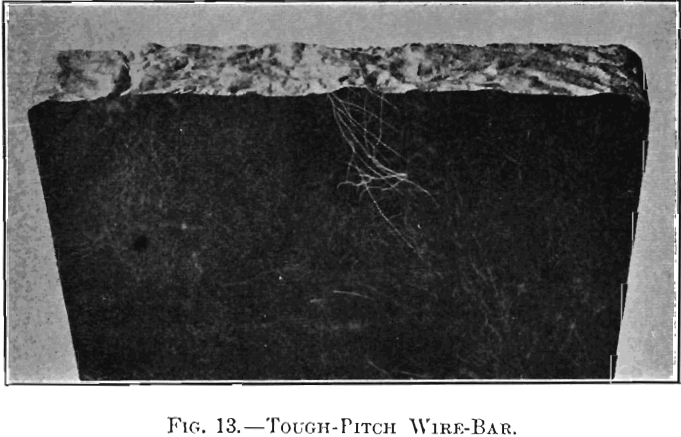
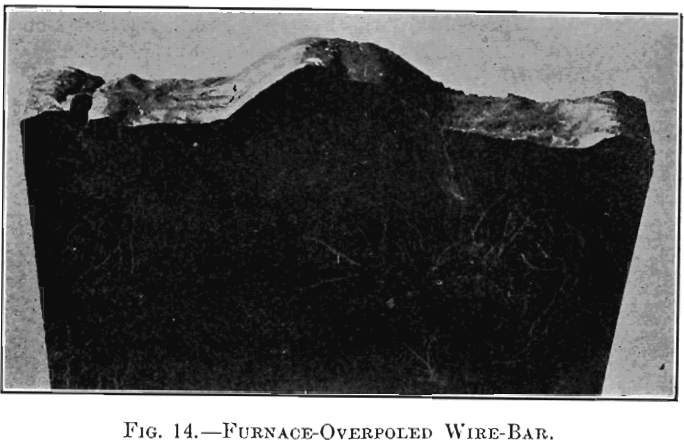
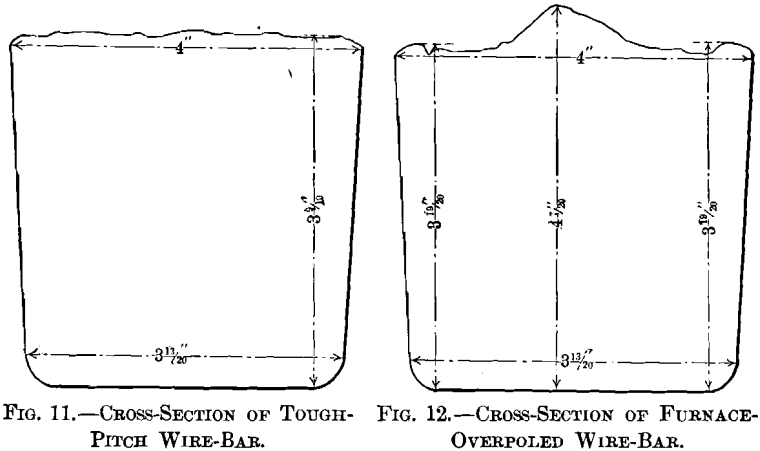
(a) Samples.—Twelve samples formed the basis of the first series of tests. They were taken from a refining-furnace of 100 tons capacity. Sample No. 1 was taken after melting down the electrolytic copper and skimming the slag. Sample No. 2, taken six hours later, represents set copper. During the following two and a quarter hours of poling, samples Nos. 3 to 11 were taken at 15-min. intervals; sample No. 11 is tough-pitch copper. The charge was then cast, with the exception of a small amount, which was overpoled until a cast bar upon cooling “ threw a worm ” or “ spewed.” A section of this bar formed sample No. 12. Samples Nos. 1 to 10, represented in Figs. 1 to 10, were 3 in. long and 1 in. square, being one-half of the test-bar usually cast during refining. All the surfaces are uneven until tough-pitch copper has approximately been reached with Fig. 10. Samples Nos. 1 to 5 show cavities; these disappear with sample No. 6, taken when poling had progressed for 45 min. Samples Nos. 11 and 12, representing tough-pitch and furnace-overpoled copper, are shown in cross-
section in Figs. 11 and 12; their photographed surfaces are given in Figs. 13 and 14. The tough-pitch copper has the characteristic wrinkled level surface; the furnace-overpoled copper
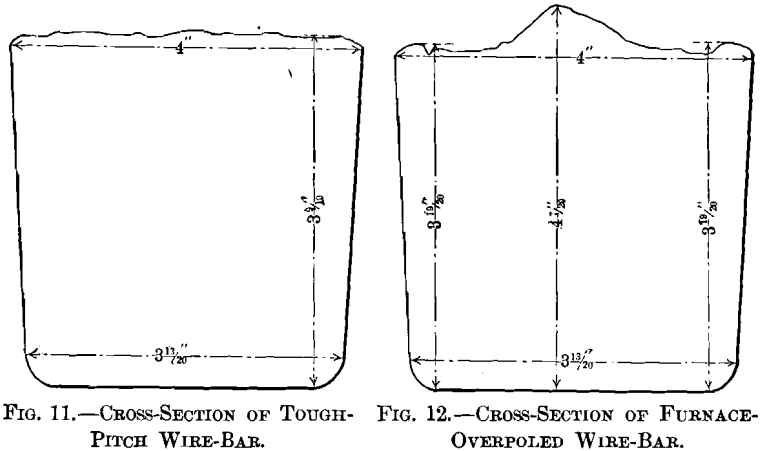
has a rough surface, a large ridge at the center and two small ones at the sides.
(b) Specific Gravity.—The figures for specific gravity, given in Table I., were calculated from the data obtained in the electrical tests by the formula, spec. gr. = w/Al, in which w is the weight of the wire sample in grams, A the area in square centimeters, and l the length in centimeters.

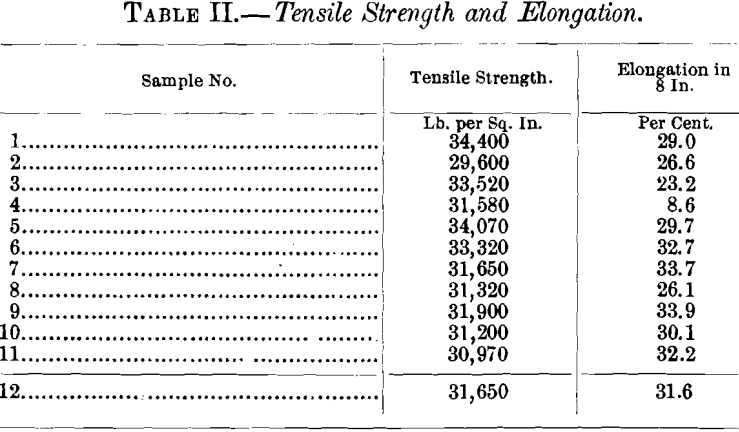
(c) Tensile Strength and Elongation.—On account of the form of the samples, the mechanical tests had to be made with specimens drawn into wire. For this purpose, pieces 0.5 by 1 in. and 2.5 in. long were cut from the specimens in such a way as to leave the surfaces of the originals intact. The pieces were drawn to 0.04 in. in diameter, corresponding to No. 18 B. & S. gauge, and then annealed together by a Connecticut brass manufacturing company. Difficulties in drawing were encountered only with samples Nos. 1 to 4, the last drawings of which had to be made by hand. The wires obtained varied in length from 15 to 35 ft., with the exception of that from sample No. 2 (set copper), which gave a length of only 7 ft. The tests were made with a Fairbanks wire-testing machine, the wires used being about 2 ft. long. The averages of the results are assembled in Table II.
(d) Electric Conductivity.—The tests were made with a Wheatstone bridge, using wire-lengths of about 5 ft. The averages of the results are given in Table III.
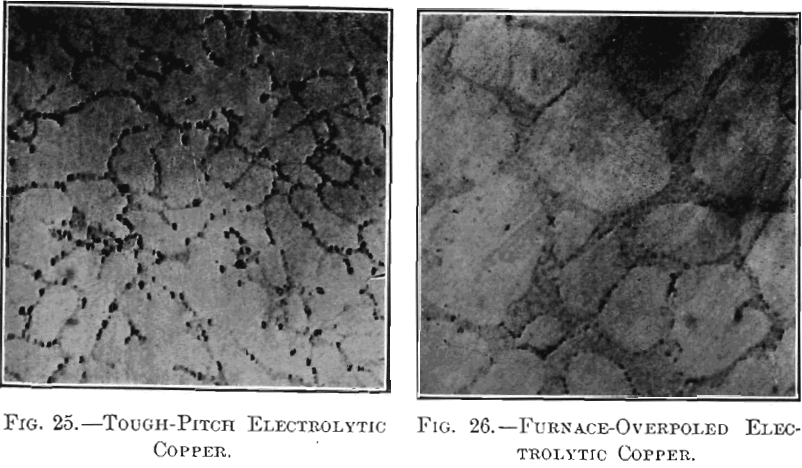
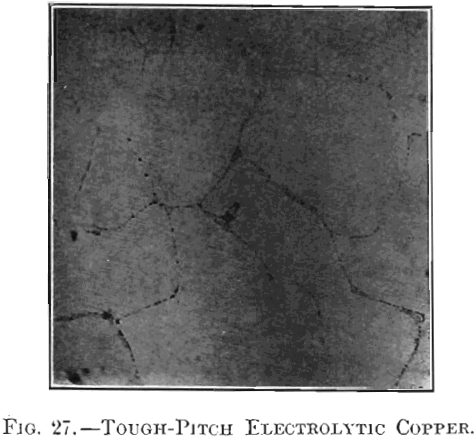
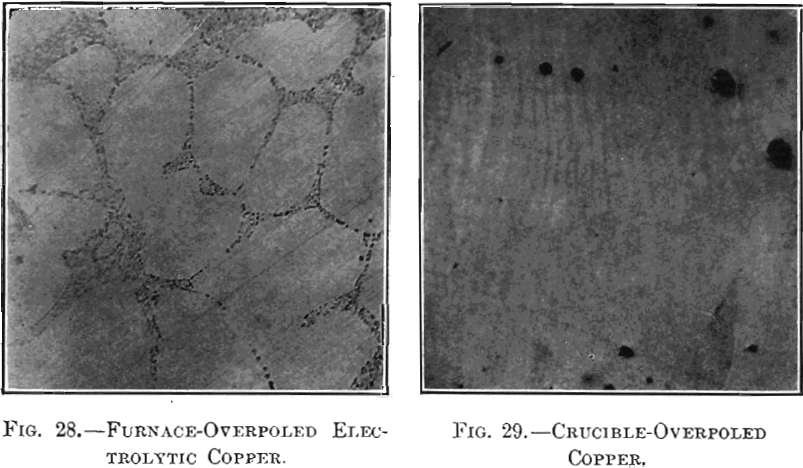

(e) Chemical Changes.—Only the chemical changes relating to copper, iron, sulphur and oxygen were considered. Copper, iron and sulphur were determined by chemical analysis, oxygen by planimetric measurement. All analytical work was carried through according to the methods perfected by G. L. Heath and given in his paper, Methods for the Complete Analysis of Refined Copper. The wires from the physical tests formed the analytical material. Two separate samples had to be weighed out for the determinations, one for copper and iron, and one for sulphur, as the copper was deposited electrolytically from a sulphuric acid solution. Iron was precipitated from the sulphate solution after this had been freed from copper. In the planimetric measurement of oxygen from enlarged photo-micrographs, the mode of procedure given by Hofman, Green and Yerxa was followed. The averages of the results are given in Table IV.

Discussion of Data.—In order to bring out the results more clearly than is convenient in the detached tables, and thus facilitate a review, all the data have been assembled and represented graphically on a single sheet in Fig. 15. Their discussion is confined for the present to samples Nos. 1 to 11, inclusive ; samples Nos. 12 and 13, dealing with overpoled copper, will be taken up later.
The copper (plus silver) content, which at the start (sample No. 1) was 99.22 per cent., is seen to fall to 98.12 per cent.,
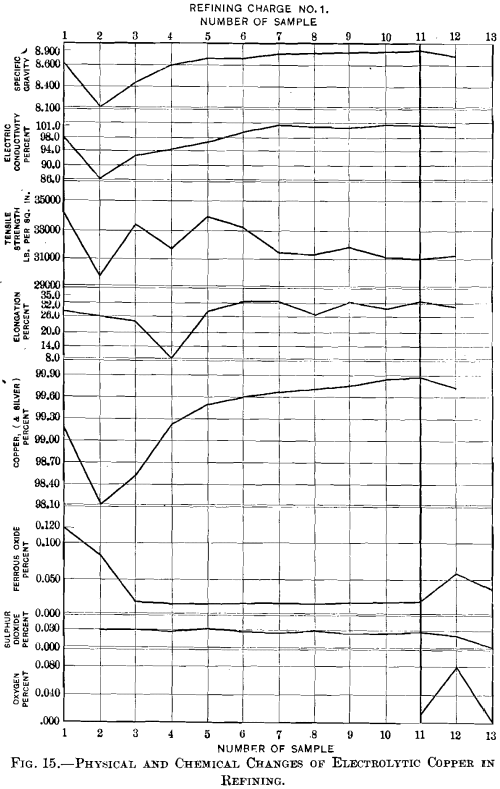
when, after oxidation for 6 hr., the stage of set copper (sample No. 2) has heen reached. During the first hour of poling the percentage of copper rises quickly, reaching 99.61 per cent, with sample No. 6, then more slowly, attaining the maximum of 99.87 per cent, with tough-pitch copper (sample No. 11).
Ferrous oxide, usually lower than sulphur, is here higher. It shows a peculiar behavior. It would have been expected that the original 0.121 per cent, would have been slagged off completely during the six hours of oxidizing fusion, but it was reduced with set copper to 0.086 per cent., and only then brought to the minimum of 0.022 per cent, by the first quarter-hour of poling, to remain practically unchanged. The only explanation that suggests itself is that iron was taken up from the pipe through which air was forced into the copper during the oxidizing stage, and that this was quickly expelled when the pipe had been withdrawn and the pole inserted.
While the sulphur-content is high for electrolytic copper, it remains practically constant at 0.030 per cent., the extreme figures being 0.027 and 0.032 per cent. It appears, then, that with electrolytic copper no sulphur is eliminated during the refining operation.
Oxygen determinations were confined to sample No. 11, tough-pitch copper, which contained 0.0119 per cent.
The specific-gravity curve shows the same general trend as that of the copper-content, as was to be expected; starting with 8.642, it reaches the minimum of 8.116 with set copper, and the maximum of 8.906 with tough-pitch copper.
Electric conductivity gives a curve resembling those of copper-content and specific gravity. The electric conductivity, 98.16 per cent, with sample No. 1, reaches its minimum of 86.61 per cent, with set copper (sample No. 2), and then rises quickly to 101.23 per cent, with sample No. 7, 1.25 hr. after poling had been started, and remains approximately at that figure for the additional one hour of poling necessary to reach the tough-pitch state. While electric conductivity has become a very important test for judging the physical properties of copper, the curve shows that, at least in the present case, the conductivity-test did not tell the whole story, even though the copper under consideration was a high-grade metal.
The tensile strength of 34,400 lb. of sample No. 1 shows a gradual decrease to 30,970 lb. with tough-pitch copper (sample No. 11). Fluctuations in the curve between samples Nos. 3 and 7 are caused by the difficulty in adjusting the wires, brittle at this stage, in the jaws of the machine.
The elongation increases as the poling progresses; the irregularities are due to the same causes as those of the variations in the tensile-strength tests. Starting with 29 per cent., it reaches a minimum of 8.6 per cent, half an hour after poling has begun, and a maximum of 33.9 per cent, half an hour before the stage of tough-pitch copper.
Refining-Charge No. 2
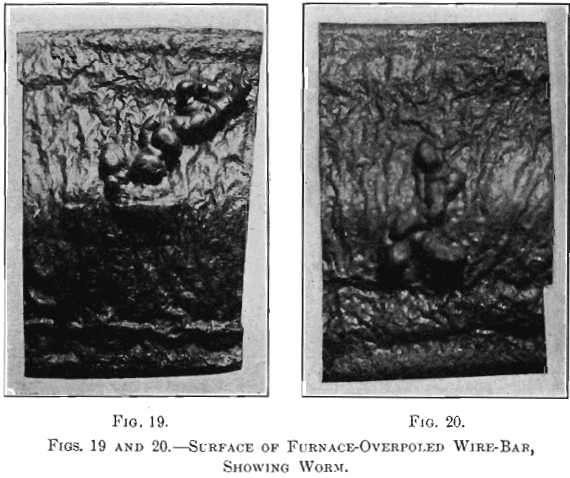
(a) Samples.—Fifteen samples, taken from a refining-furnace of 120 tons capacity, were examined to study the changes that took place during the operation. Six samples, Nos. 13 to 18, were small ingots, 4 1/8 in. long by 2¼ in. wide at top and 1 15/16 in. wide at bottom by 1 7/8 in. thick. Sample No. 13 represents set copper, sample No. 14 was taken after the first pole had been withdrawn, sample No. 15 after the two subsequent poles had been used up, sample No. 16 after poles 4 and 5 had been taken out, sample No. 17 after poles 6 and 7 had been removed, and sample No. 18 after the copper had reached the tough-pitch stage. The specimen for microscopical examination was taken from the center of a cross-sectional piece cut off from the end of a bar; the material for chemical analysis was obtained by boring five holes 3/8 in. in diameter into the bottom of a bar, a hole penetrating one-half. The six samples, Nos. 13a to 18a, were duplicates of Nos. 13 to 18, cast into the form of a nail, 5 5/8 in. long and 5/8 in. in diameter at the top, and 0.5 in. at the bottom. The lower half of a nail was cut off to be drawn into wire for the mechanical and electrical tests. The wires were drawn to No. 18 B. & S. gauge at the works of the American Steel & Wire Co., Worcester, Mass. The drawn wires were annealed together. Difficulties similar to those with the brittle specimens of refining-charge No. 1 were also encountered here. The three samples, Nos. 19 to 21, are sections of full-size wire- bars of furnace-overpoled copper; their contours, shown in Figs. 16 to 18, represent typical crowned surfaces. Figs. 19 and 20 are photographs of the surfaces of two of the samples in which the worm thrown was very pronounced.
(b) Specific Gravity.—The specimens polished for microscopical examination served for the determinations of the specific gravity, made in the usual way by weighing in air and in water with the necessary precautions. The data obtained are given in Table V.

(c) Tensile Strength and Elongation.—The mechanical tests were carried out in the same manner and with the same ma-
chine as those of refining-charge No. 1. The results are given in Table VI.

(d) Electric Conductivity.—The tests for electric conductivity were made at the Worcester plant of the American Steel & Wire Co. The figures are assembled in Table VII.

(e) Chemical Changes.—In addition to following up the changes which take place in the content of copper, iron and sulphur of the metal-bath during refining, planimetric measurements of oxygen were made of all the samples. The results are brought together in Table VIII.

(f). Discussion of Data.—The data obtained in examining samples Nos. 13 to 21 are plotted in Fig. 21. The distance on the abscissa between samples Nos. 13 (set copper) and 18 (tough-pitch copper) has been made approximately the same as that between samples Nos. 2 and 11 of Fig.15, which stand for the same limits in the refining of a charge.
The copper (and silver) content, 99.53 per cent., of sample No. 13, is the lowest of the series, as the start was made with set copper. In poling, it rises quickly at first to 99.91 per cent., sample No. 16, and then only very slowly reaches the maximum of 99.94 per cent, with tough-pitch copper, sample No. 18.
The determinations of ferrous oxide gave a range of 0.0057 and 0.0063 per cent., and the curve rises and falls within it without any regularity whatever. This indicates that the iron is not distributed evenly throughout the mass of the bath, and that it is not diminished in amount during the period of poling.
The variations in sulphur dioxide, 0.039 to 0.048 per cent., are greater than those of ferrous oxide, although the largest difference does not exceed 0.009 per cent. Some sulphur is expelled by poling, as set copper contains 0.048 per cent, sulphur dioxide and tough-pitch copper 0.043 per cent., but the amount is insignificant.
The oxygen curve forms an interesting inverse to that of the copper-content. The 0.211 per cent, oxygen of set copper decreased quickly with the poling until sample No. 16, with 0.073 per cent, oxygen, was taken, and then slowly, being reduced only 0.029 per cent, when the metal had been brought to the tough-pitch stage, ready to be cast. The figure of 0.211 per cent, oxygen (= 1.43 per cent, cuprous oxide) for set copper is very low; and would seem to show that with this charge the oxidizing fusion had not been carried as far as is common practice.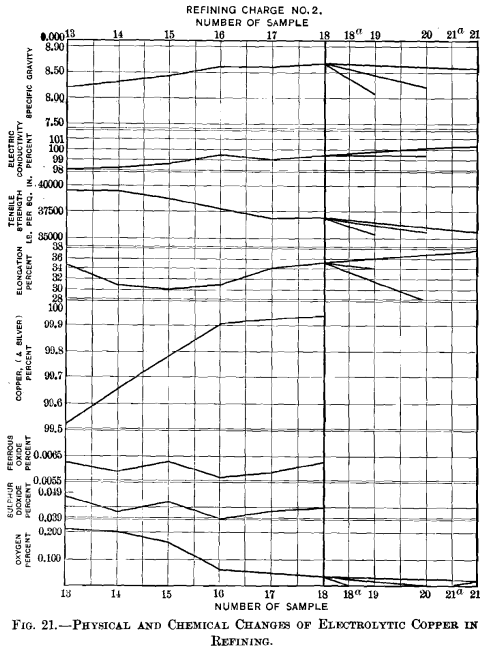
The specific gravity of the metal increases as the poling progresses, just as did the percentage of copper, more quickly during the first than during the second stage of poling; between samples Nos. 13 and 16 there is a rise from 8.23 to 8.63, and between samples Nos. 16 and 18 a difference of only 0.06.
The curve of electric conductivity resembles that of copper-content and of specific gravity. Set copper, when annealed, had a conductivity of 98.2 per cent.; this increased at first quickly, reaching 99.6 per cent, with sample No. 16; tough-pitch copper showed no improvement upon this amount.
The tensile strength decreased very little considering the amount of oxygen that had been removed; at the start it was 39,130 lb., at the finish 37,020 lb.; the fall in tenacity is more gradual and regular than was expected.
The data for elongation are irregular. There is a fall from 34.6 to 30.1 per cent., then a rise of a similar amount to 34.2 per cent., followed by a slight increase to 35.1 per cent. It was expected that the elongation would increase with the elimination of oxygen.
Summary of Refining-Charges Nos. 1 and 2
The two charges examined were electrolytic copper from the multiple process; they represented a high-grade metal and were refined in reverberatory furnaces of similar construction and capacity, and by the usual method of oxidizing with compressed air and reducing with the use of poles. It was therefore to be expected that the changes the metal underwent in poling would be similar. A comparison of the curves in Figs. 15 and 21 proves this to be the case. The percentage of copper rises quickly at first and at about the same rate as the cuprous oxide is reduced; later it increases more slowly as it becomes more difficult to deoxidize the remaining small amounts of cuprous oxide to just the quantity that has to remain with the tough-pitch copper. The amount of ferrous oxide present in electrolytic copper is very small; any excess over a minimum, varying with different charges, is quickly eliminated. The sulphur-content of electrolytic copper remains practically unchanged in fire-refining. The specific gravity and electric conductivity rise and fall with the copper-content; cuprous oxide has an effect opposite to that of copper. The tensile strength decreases as the reduction of cuprous oxide progresses; the corresponding increase in elongation is not shown by the curves as clearly as was expected.
Studies in Overpoling Electrolytic Copper
Conclusion
The evidence obtained as to oxygen-, sulphur-, and iron-content of furnace-overpoled electrolytic copper, and as to effect of temperature, does not point clearly in a single direction and permits various interpretations. There remain, however, as undisputed facts, that copper absorbs hydrogen, carbon monoxide and sulphur dioxide, and that the solubility increases with the temperature and decreases with the oxygen-content. With set copper the solubility of the gas is at a minimum on account of the low temperature and the high percentage of the oxygen of the metal bath, and set copper solidifies with depressed surface. With crucible-overpoled copper the solubility is at a maximum on account of the necessarily high temperature and the entire absence of oxygen.
Between these two extremes lies the level set or proper pitch of tough-pitch copper. The proper pitch then appears to be the resultant of the hollow pitch of set copper and the crowned pitch of overpoled copper, and to vary, independently of small admixtures of sulphur and iron, with the size of the casting; a heavy cake holding more gas requires a copper richer in oxygen to counteract the raising power of the gas than does a wire-bar.
