The three types of curve described so far completely define the behaviour of the material in a heavy liquid under ideal sink-float conditions.
In practice, we wish to use the data to predict the performance of a commercial process such as D.M.S., Jigs, Tables, etc. In these processes, the S.G. of separation will vary between certain limits about a mean S.G. due to fluctuations in operation conditions.
This variation is expected to be:
- D.M.S. ± 0.05 to 0.02 units, depending on control
- Jigs, Tables ± 0.10 to 0.15 units
The accuracy of the split , in terms of the mean and characteristic assays of the products, will depend on the weight of material sinking or floating when the separating S.G. is varied about its mean value during separation.
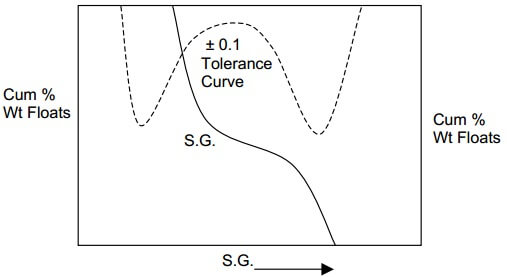
To enable this to be read off the curves directly, it is usual to plot the S.G. Distribution curve. This is related to the slope of the S.G. curve and is calculated simply by finding the difference in the cumulative % weight floating or sinking between the stated tolerance limits for each mean separating S.G. These differences are plotted on the cumulative % weight of sinks or float ordinates against mean S.G.
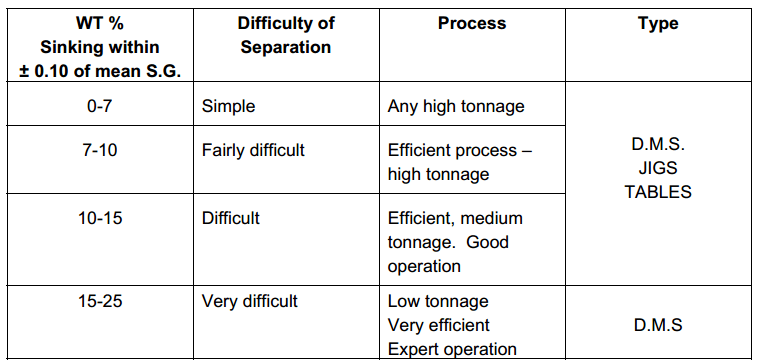
For coal, a table has been built up by experience to give the ease of separation for given weight percentages or material sinking within ± 0.10 of the mean S.G. of separation.
The curve with two maxima will be formed in general, the area of interest being the portion from one of the maxima to the plateau region.


