Several constructive and fundamental studies have been made in the analysis of data obtained from experiments carried on with batch ball and rod mills. The operating characteristics of ball milling in small continuous circuits have also been appraised. It is from these analyses that some of the theories of comminution have been developed.

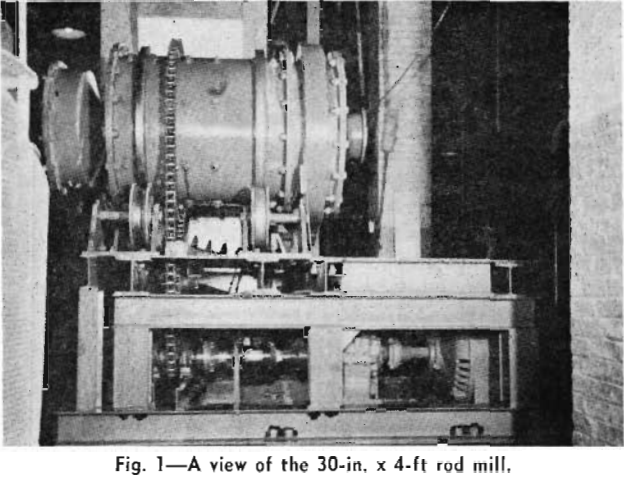
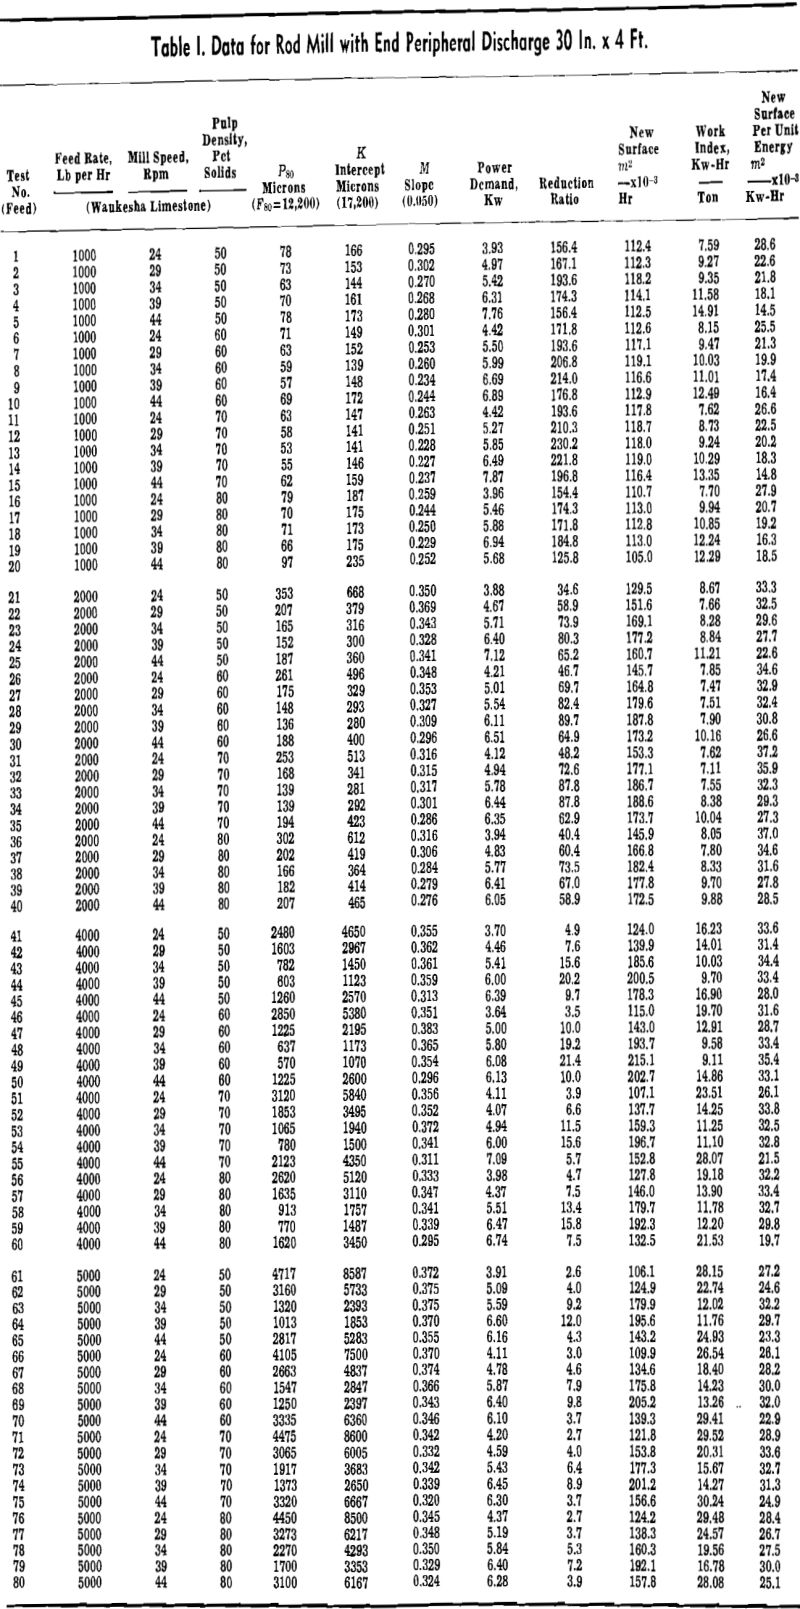
Data presented in this paper are those from the 30 in. x 4 ft end peripheral discharge rod mill, when limestone was ground at feed rates of 1000, 2000, 4000, and 5000 lb per hr, at pulp densities of 50, 60, 70, and 80 pct solids, and at mill speeds of 50, 60, 70, 80, and 90 pct of the critical speed. These 80 tests have all been run at least twice, and occasionally a third time, to prove that the data obtained were reproducible. The techniques of operation and the methods of quantification of results are described in the following pages and the results analyzed statistically to show the significant variables. The variables are plotted to show the relationships that exist.
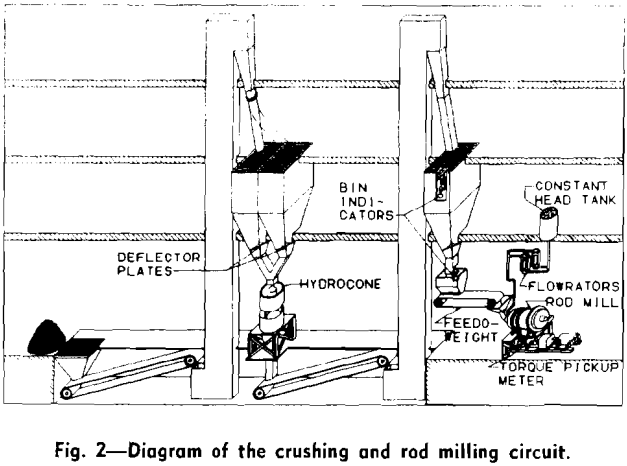
Preliminary tests showed that a —¾ in. crushed stone as it was received from the supplier did not give a consistent sieve analysis; hence, a coarsely crushed stone was obtained from the quarry and a uniformly sized rod mill feed was prepared in the laboratory. Minus 1½-in. +¾-in. stone was received in 8-ton dump trucks and passed through a 2-in. grizzly onto a 20-in. conveyor belt. From the belt the stone was lifted by a bucket elevator and discharged into two 15-ton bins.
The crusher produced a rod mill feed, 96.8 pct passing ¾ in., which was transferred by conveyor belt and bucket elevator into a third 15-ton bin similar to the ones described. Near the top and in the center of the rod mill feed bin, a Tellevel bin indicator was installed. Whenever the level of the stone settled below a certain point the indicator automatically activated the crushing circuit to produce more crushed stone until the bin was filled again. To minimize segregation, the rod mill feed bin was also equipped with a square steel distribution plate near the bottom.
The product from the mill flowed down a launder to a spiral classifier. Classifier overflow was pumped to a thickener which discharged by gravity to a drum filter. The filter cake was discarded along with the classifier sands collected in hoppers.
All the experiments were conducted with a rod charge which filled 40 pct of the mill volume. The rods were cold drawn steel round stock which had a hardness of 134 Brinell and analyzed 0.26 pct C, 0.008 pct P, and 0.037 pct S. Spectrochemical analysis showed the presence of 0.55 pct Mn, 0.17 pct Si, 0.03 pct Ni, 0.02 pct Cr, 0.003 pct Mo, and 0.08 pct Cu. Twelve rods were of 2½ in. diam, 22 of 2 in. diam, 32 of 1½ in., and 46 of 1 in. All were 45¼ in. long. Total weight of the rod charge was maintained as near 2850 lb as possible. At regular intervals during runs the charge was removed and weighed. Any loss was compensated for by the addition of rods.
Water from a constant head tank was added to the mill through Flowrators which were set to give the proper amount of water for the pulp density required.

After the circuit was operating satisfactorily, the conditions were maintained for 45 min to insure equilibrium within the mill. During this time the pulp density was roughly checked by means of the pulp balance. Following the 45-min interval the tapes on the recorders were marked and were collected over a 10-min period. Samples of the mill discharge were also collected during this period. Three samples weighing about 30 lb each were taken at 3-min intervals.

Dry sieve analyses of the feed samples and wet- and dry analyses of the products were made. Results were plotted on log-log graphs with the log cumulative percent passing a given mesh as the ordinate and the log mesh size in microns as the abscissa according to the method described by Schuhmann. Feed and product analyses were plotted on each graph. From each curve the slope, K intercept, and the F80 or the P80 were obtained.
From these data the reduction ratio and the new surface produced were calculated. The energy requirement per unit of new surface produced and the Bond work index were also calculated, see Table I.

Work indices were calculated from Bond’s formula. This formula, as pointed out by R. A. Person of the Process Laboratory at Allis-Chalmers, can also be derived from the general equation reported by Walker, Lewis, McAdams, and Gilliland. If n in their equation is replaced by 3/2, an equation identical to the Bond work index formula can be derived. Thus an energy size reduction relationship which is halfway between the Kick and Rittinger relationships is obtained.
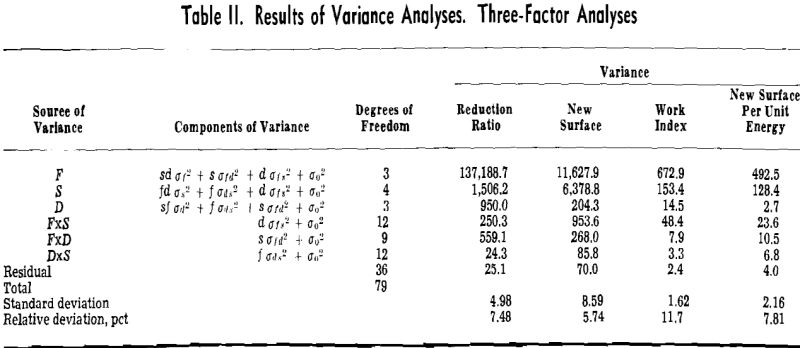
To determine what significant relationships were indicated by the variance analyses, the insignificant factor, density (three-factor analyses), was averaged out of the data, and curves were plotted of the dependent variables against feed rate for each level of mill speed, and against speed for each level of feed rate. To investigate the interactions of feed rate and mill speed, and feed rate and pulp density, the dependent variables were examined at each level of feed rate to determine how they varied with mill speed and pulp density when these independent variables were found to be significant (two- factor analyses). When an independent variable was not significant, it was averaged out of the data and the averages were examined for the relationship with the significant variable.
Bond Work Index: The work index was at a minimum at feed rates from 1500 to 3000 lb per hr, depending upon the speed of the mill. It was at a minimum at speeds from 50 to 80 pet of critical, depending upon the feed rate.
It was again necessary to resort to the original data to identify the FxD interaction. Pulp density was shown to have a significant effect at all feed rates except at 1000 lb per hr. At 2000 lb per hr minimum work index was obtained at 60 to 70 pct solids; at 4000 lb per hr, 50 to 60 pct solids; and at 5000 lb per hr, at 50 to 60 pct solids. Apparently as the feed rate is increased, the pulp density in the mill should be more dilute to obtain minimum work index.
The lowest work index for all operating conditions investigated was 7.5, which was obtained at 2000 lb per hr, at 60 pct of critical speed. The reduction ratio with these conditions was 65.4, which represents a reduction from 80 pct passing ½ in. to about 80 pct passing 65 mesh. This work index is practically the same as that calculated from the ball mill grindability at 100 mesh. A work index almost identical to that calculated from the rod mill grindability at 14 mesh, 13.9, was obtained at a feed rate of 5000 lb per hr and at 80 pct of critical speed. The reduction ratio with these conditions was 9.5, which is similar to the ratio obtained in many commercial installations.
For a reduction ratio of 7.3 (the ratio at which a 15 pct increase in capacity was noted with each 10 pct increase in the percentage of critical speed), the following work indices are indicated by the curves of Fig. 5. At 50 pct of critical speed and 3700 lb per hr, a work index of 17.0 is indicated. At 60 pct of critical and 4300 lb per hr, a work index of 15.8 is shown. At 70 pct of critical and 5000 lb per hr, a work index of 15.3 is shown. It appears that the increased capacity with increased speed was obtained at a greater efficiency.
A variance analysis was made of the normalized work indices. The same factors were found to be significant in this analysis as were found in the previous one. However, the relative deviation was more than double the previous value. This occurred probably because the removal of the variation with product size, formerly attributed to feed rate, decreased the total known variation and made the un-known variation or error relatively more important.
It was found that as the feed rate to the mill increased, the mill should be operated at higher speeds up to 80 pct of critical to obtain maximum reduction, maximum production of new surface, minimum work index, and maximum production of new surface per unit energy.
