Table of Contents
A mathematical model was developed for the grinding and flotation section of Union Carbide’s Bishop mill and this model was used to indicate how variations in grind, retention time, and calcite and fluorite content effects the mill capacity, tungsten units produced, and the grade and recovery of the scheelite concentrate. A model such as this is a starting point in determining the economic optimum running condition for a mining and milling operation and an example of this is given.
Procedure & Data
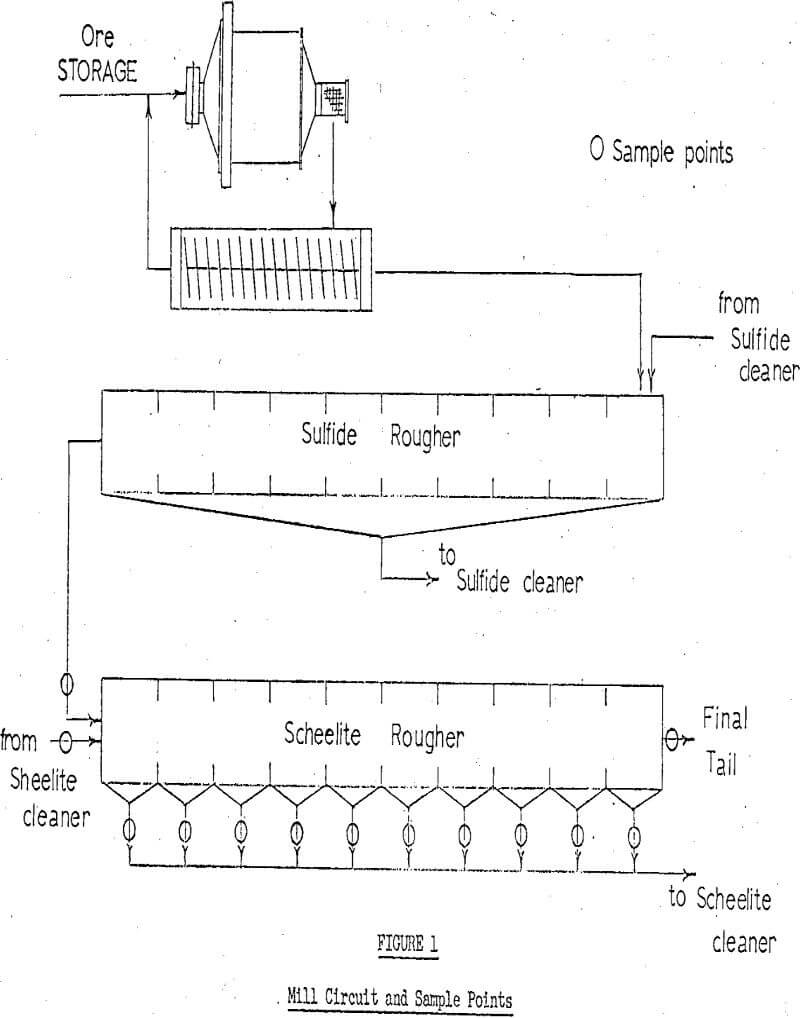
Samples were taken of the sulfide rougher tails, the feed to the scheelite float section, seheelite cleaner tails and each of the tails and concentrates of the 10 scheelite rougher cells in that section. Time-weight samples were taken of each concentrate and the cleaner tails so that mass flows could be calculated. Each concentrate sample was weighed wet, screened wet on a 200-mesh screen, filtered and dried. The dried sample was weighed and pulp densities and mass flows calculated. Figure 1 shows the flotation circuit and the sampling points.
During the sampling period,the flotation procedure was not changed; therefore no information was obtained on many of the flotation variables. The results can be used, however, to indicate how retention time, feed rate, particle size, and stage addition of the collector affects the process.
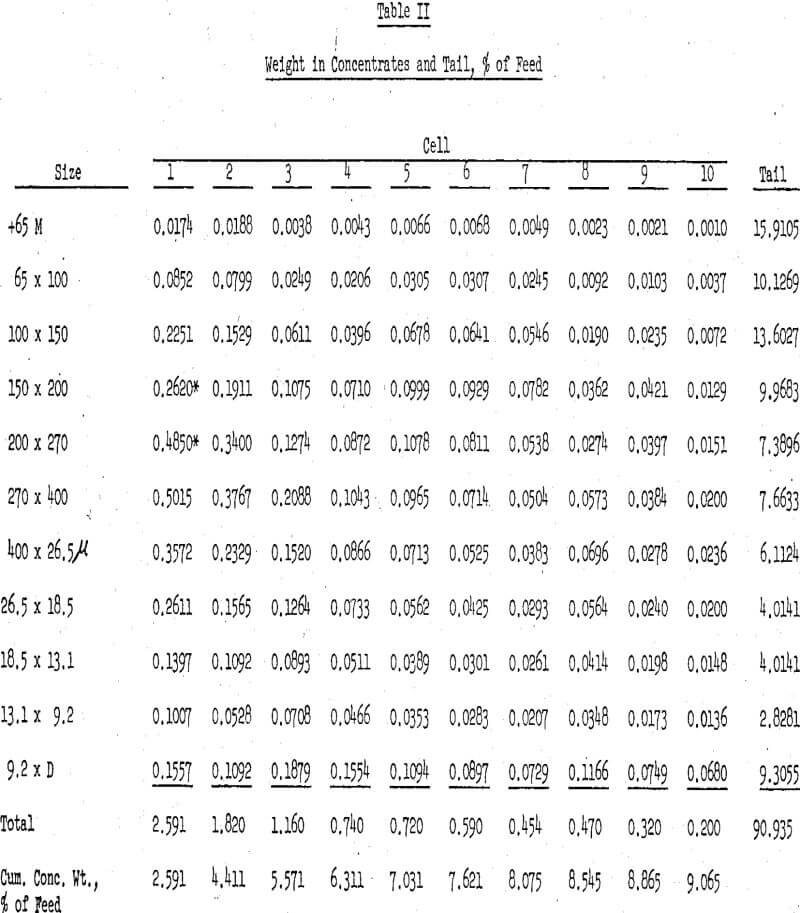
A complete size analysis was run on the concentrate from each of the 10 cells using the standard Tyler sieve series to 200-mesh and the infrasizer for the sub-sieve range. The size fractions of the feed, final tail, and each concentrate sample were analyzed to determine the WO3, CO2, and fluorine contents. From these values the scheelite (CaWO3) calcite (CaCO3) and fluorite (CaF2)contents were calculated.
Discussion
The Integrated first order rate equation applied to a series of stirred tank reactors (flotation cells) can be written as:

where k = 1st order rate constant (min-¹)
q = feed rate (cu. ft./min.)
V = effective volume of one flotation cell (cu. ft.)
n = number of flotation cells
This equation assumes that the concentrate weight is small, only a fair assumption in the process being studied. Applying the concept of a maximum recovery the “100” in Equation (1) is replaced by R∞ (the maximum recovery) and Equation (1) becomes:
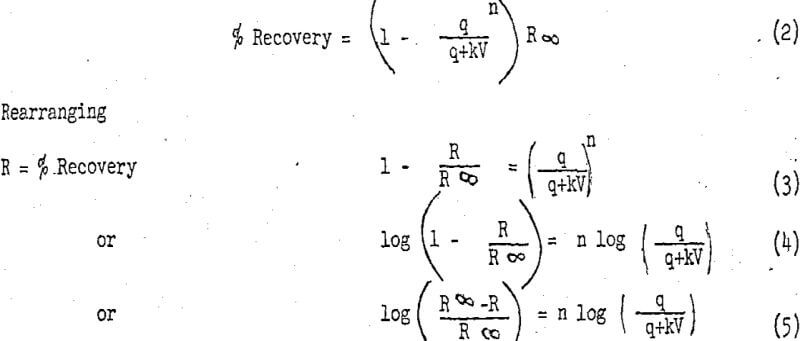
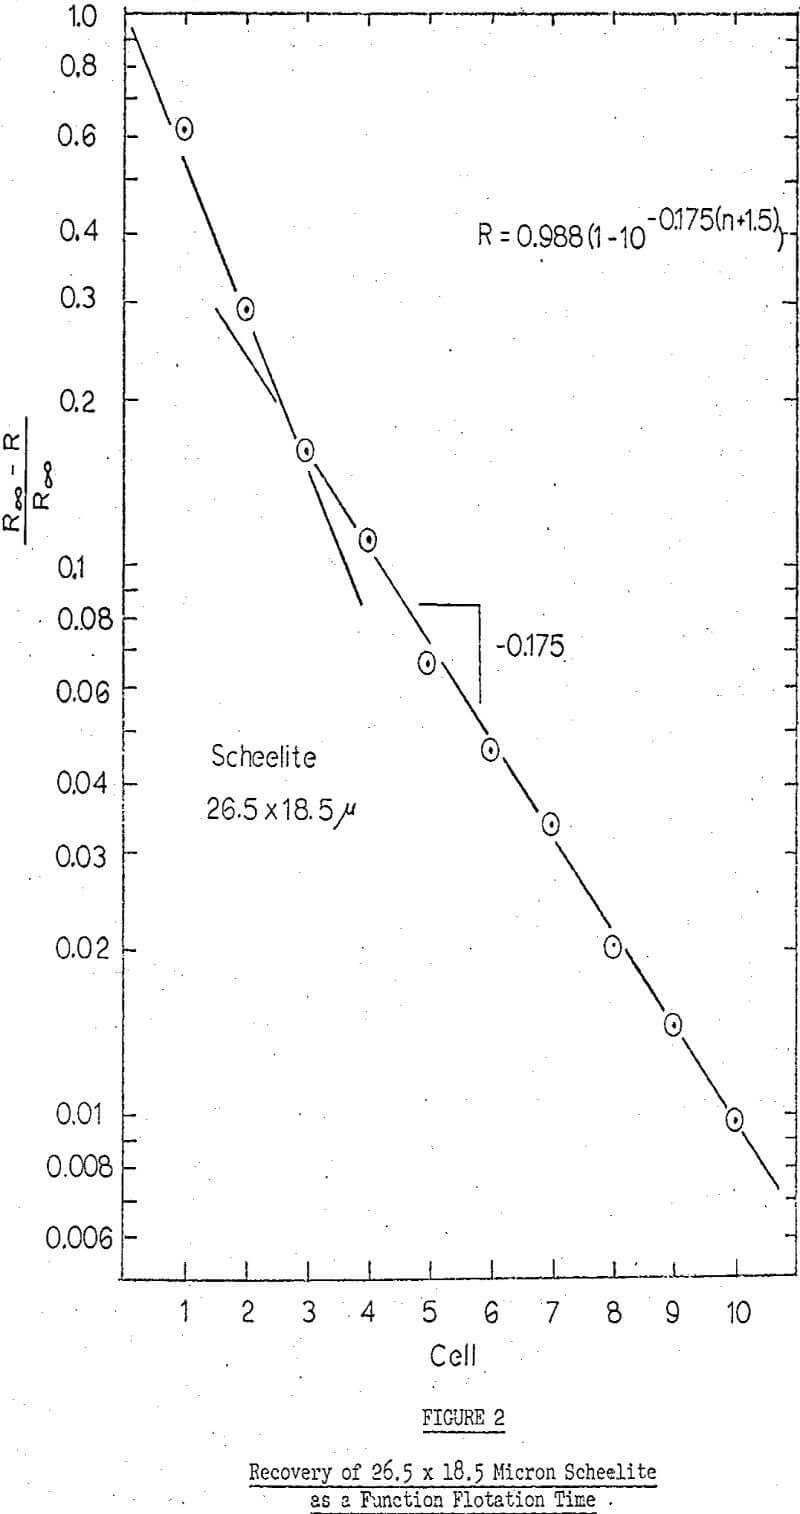
Therefore, if log R ∞ -R/R ∞ is plotted verses n (the number of cells) a straight a line of slope log q/q+kV should be obtained. Thus, the determination of R∞ becomes a series of successive approximations until a value for R∞ is arrived at which gives a straight line.
it was found that “q” equals 15.7 a ft./min. Therefore, the slope of the curves can be represented by the equation:
slope = log 15.7/15.7 + 15.6 k
Now, knowing q and V, k can be calculated. Additional collector was added in between cells 4 and 5 the flotation rate increased (i.e., the slope of the curve steepened). However, the data do fit one straight line from cell 4 to 10. The general equation of this line is:
Recovery = R∞ (1 – 10 -B(n+c))
where B and C are constants and n is the cell number. The model to be described for the Bishop mill is a first generation model based on one set of samples and basic theories of grinding and flotation.
The model is based on the fact that flotation recovery is a function of particle size and flotation retention time. (Reagent concentrations, pulp densities, and other variables were not studied and are not included in the model. They were therefore held constant.) If the size distribution changes, the recovery changes, not only does it change for scheelite but for fluorite and calcite as well and, therefore, the grade of the concentrate also changes. In the present grinding circuit operating at about 600% circulating load and drawing 125 HP, the only way to change the grind (size distribution) is by changing the feed rate.
