Table of Contents
Where water is abundant, hydraulic mining of placer deposits is usually the least expensive extraction system. In the past, large volumes of water were required, and pressures rarely exceeded 100 psi. The system fell into disfavor because of the excessive amount of silt and debris returned to streams.
With the development of more efficient pumps and the availability of power, hydraulic mining has again become a promising mining method in other kinds of deposits. The method offers a number of advantages, especially in mining solid hydrocarbons or carbonaceous materials. Dust problems are practically eliminated, explosives are eliminated, as are overbreak and weakening of the roof, and the chances of spark ignition of dust and gas explosions are reduced. These advantages and the availability of pumping systems with operating pressures capable of fracturing some consolidated materials have interested many development and research people.
In 1949, the American Gilsonite Co., Salt Lake City, Utah, started modern hydraulic mining in the United States at Bonanza, Utah. Gilsonite, a solid hydrocarbon, is mined hydraulically, and the slurry is piped 72 miles over a mountain pass to a refinery near Grand Junction, Colo.
In 1958, the Bureau of Mines initiated hydraulic mining research after a literature survey of mining methods in the United States and abroad indicated that hydraulic mining of coal might be feasible. The first experiments by the Bureau were conducted in the flat-lying Pittsburgh coalbed. These tests demonstrated that solid coal could be mined hydraulically with water pressures of 4,000 psi and volumes up to 300 gpm. The cutting rate increased with the kinetic energy of the jet, the traverse speed of the jet, and the proximity of the water monitor to the face. The results also indicated the possibility that a much harder material, such as Pennsylvania anthracite, might be mined hydraulically.
A second series of tests was conducted in steeply pitching bituminous coalbeds at Roslyn, Wash. The kinetic energy produced by the pump (40 gpm, 4,500 psig) proved too low for development work and a large-capacity pump (300 gpm, 4,000 psig) was then moved to the site for another series of tests. A remote-controlled water monitor attached to self-advancing hydraulic roof supports was developed and used successfully in mining the pitching coalbed. Production rates for hydraulic mining, however, were lower than in conventional mining.
Laboratory tests conducted underground to determine the effectiveness of various jetstreams for cutting coal have determined jetstream pressure distributions and coal cutting rates for a number of nozzle designs. The results show that the total force of the jetstream, rather than its maximum pressure or total kinetic energy per unit time, is the most significant quantity affecting the coal cutting rate and that a 3/8-inch tapered nozzle with a straight section 3 diameters long is the most efficient configuration and produces the most compact jetstream.
Experiments carried out on Pennsylvania anthracite (260 gpm and 3,700 psi) served as a basis for a full-scale experiment in an anthracite mine at Sugar Notch, Pa. A vertical, nine-plunger, positive-displacement pump (300 gpm, 5,000 psi) driven by a 1,000-hp electric motor was located on the surface approximately 400 ft above the Bottom Red Ash coalbed. Boreholes containing the high-pressure waterline, communication line, powerline, and compressed-air line connected the surface installation with the underground equipment. A hydraulic “jumbo” was designed especially for this experiment, and the nozzles used were an adaption of the “3D” nozzle used in previous experiments. Over 13,000 tons of coal was mined at rates as high as 1.3 tons per minute for a complete face advance.
The second Bureau of Mines report on research in hydraulic mining of Pennsylvania anthracite describes a modified factorial experiment to determine the effect of operating factors. The significant factors are the interaction of pressure and volume, the traverse speed of the jet, and the pattern of cut. A prediction equation was determined, based on the operating parameters of the hydraulic jumbo and the characteristics of anthracite.
In 1970, the Oak Ridge National Laboratories conducted research on the breaking of hard rock with high-pressure water jets. Sandstone, limestone, and granite were cut using various jet pressures, nozzle diameters, jet traverse velocities, impact angles, standoff distances, rock orientations, and spacing between cuts. Threshold cutting pressures and specific energies were determined for each type of rock.
Abroad, investigation of water jets has been carried on for over two decades. In the U.S.S.R., low-pressure jets have been used successfully to mine coal, while high-pressure jets have been used in the laboratory to cut and break rocks. Such jet parameters as jet continuity, jet stability, nozzle design, unit pressure, standoff distance, total impact pressure, and turbulence have been studied.
In Great Britain, investigations have been carried out on jet stability, nozzle design, effective pressure, and angled jets. Most of these investigations have been limited to softer rock and to lower velocities than those in the U.S.S.R.
The Bureau’s original studies were concerned only with coals. This report describes laboratory experiments to determine cutting rates in concrete; to relate these cutting rates to various water jet parameters, traverse speed, and the physical properties of the concrete; and to determine the specific energies related to various water jet parameters. The equations developed in this study may be used to predict cutting rates in other rock materials as a function of the water jet parameters (within the range of data used in this study) and of the different combinations of the physical properties of a material.
Experimental Procedure
Test Equipment
The installation included a high-pressure pump, water supply, electric power, compressed air, and all auxiliary equipment needed to operate the pump and experimental equipment. The pump facilities have been described in detail by Buch.
High-Pressure Pump and Waterline
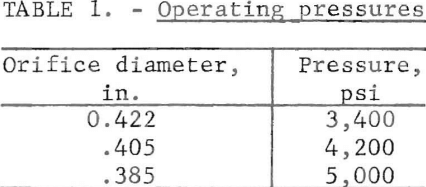
The high-pressure pump was a 5,000-psi, 300-gpm, nine-plunger, positive-displacement pump driven by a 1,000-hp, 2,300-volt, ac, synchronous motor with a speed of 300 rpm. Pressure buildup at the pump was controlled by the size of the nozzle orifice (table 1). The nozzles were the “3D” nozzles used in previous Bureau hydraulic-mining research.
Water flowed through a 4-in. XX, ASTMA-A 106 grade B seamless steel pipe for a distance of 80 ft, where it was reduced by a reducing coupling to 2 in. size and then connected to a 10-ft length of 2-in. reinforced, flexible, high pressure hose attached to the water monitor. This flexible hose allowed movement of the monitor. All systems were hydrostatically tested periodically with a hydrostatic pump at 7,500 psi.
Water Monitor and Test Stand
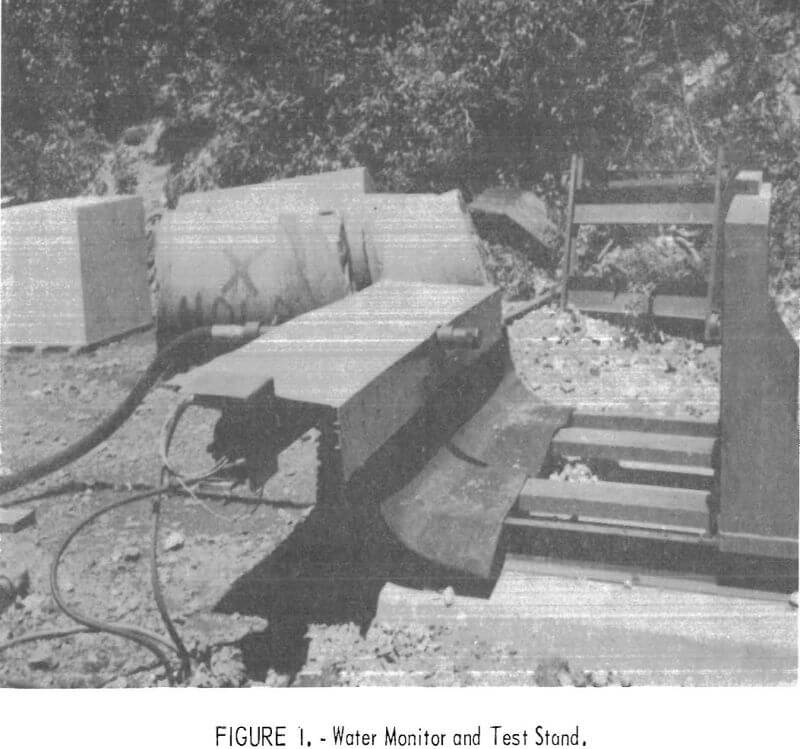
The hydraulic monitor mount and test stand were mounted on a concrete base. The monitor mount consisted of two geared screwjacks supporting a carrier for the monitor. This carrier permitted both lateral and vertical movement over a range of 3 ft. Vertical movement was provided by the two screwjacks and lateral movement by a chain drive powered by a ¼-hp electric motor and regulated by a reductor and ratio-control unit. The length of the traverse was controlled by two stops that activated a limit switch. The monitor could be adjusted for angles of impact from 11.5° to 102.5° and for different standoff distances (fig. 1).
The test stand provided for mounting test specimens either directly on the frame or on a small, movable carriage. A backstop was constructed to provide a firm support against which the test specimen on the movable carriage could be placed. A hydraulic jack with a bearing in the top was positioned underneath the test stand so that the test blocks could be turned to expose an untested faze to the jet.
Concrete Test Blocks
Because rock would have been too costly to procure and transport in the amounts required, the test blocks were made from concrete. The properties of concrete are similar to those of rock, and the concrete could easily be poured into forms at the test site.
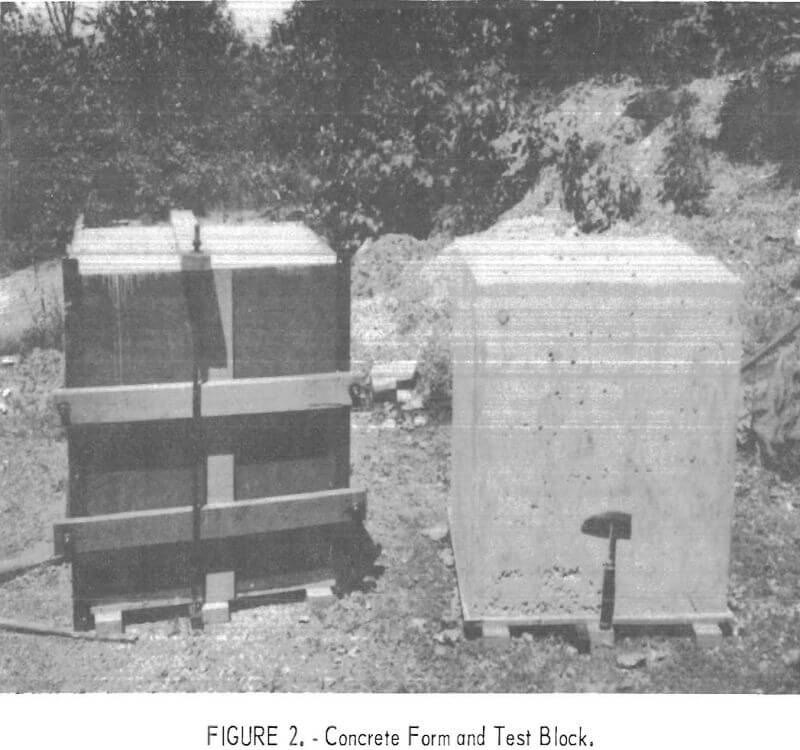
Three-foot cubical blocks of five different commercial strengths (2,000; 2,500; 3,000; 3.500; and 4,000 psi) were fabricated from ready-mix concrete.
Six to eight blocks were poured from one batch; in all, 45 blocks, the number required for the factorial design, were made. The concrete was vibrated to insure the best consolidation and to prevent segregation of the concrete in the forms (fig. 2). During the pour, test cylinders of each block were made for physical property determinations. The blocks were allowed to cure at least 28 days before being tested.
Testing Procedure
A concrete block was positioned on the carriage, and the backstop was bolted into position. The carriage was moved until it rested against the back-stop, and the water monitor was adjusted to the required height and stabilized to prevent vertical movement of the water jet during operation. The appropriate nozzle for the required pressure was inserted, and the monitor was adjusted to the predetermined standoff distance and impact angle. The ratio-control unit was set for the predetermined traverse time, and the monitor was positioned for the beginning of a test run.
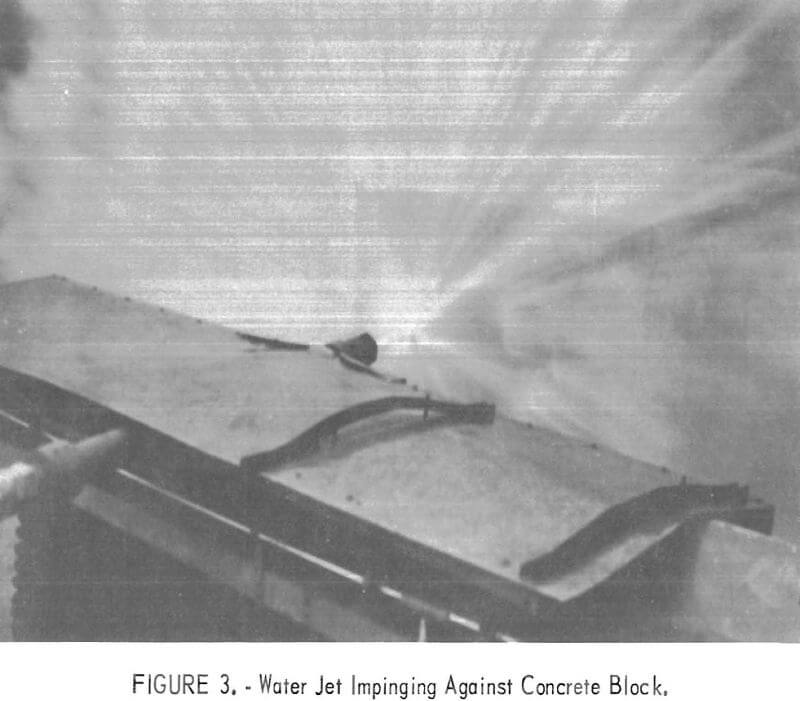
The pump was started unloaded to make certain that the lines were free of obstructions and that all lines were full of water. The pump was then activated and 8 seconds later, the pump was loaded. When the pump was loaded, the traverse control switch was activated, and the test run began (fig. 3). At the end of the test run, the pump was unloaded and stopped automatically, and the
traverse control switch was turned to “OFF.” During the test run, the pressure and time were monitored and recorded by recording gages and an XY recorder.
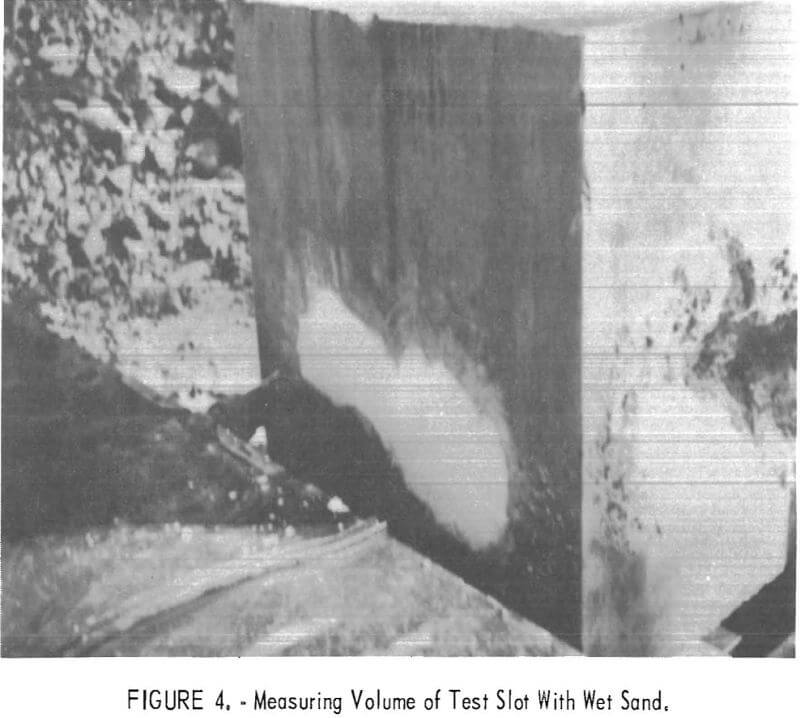
The cut in the concrete was examined, and the depth of penetration, the volume of material removed, and the width of the slot were measured. Depth and width were determined by averaging measurements taken across the slot. Volume was determined by the amount of wet sand that could be packed into the slot (fig. 4).
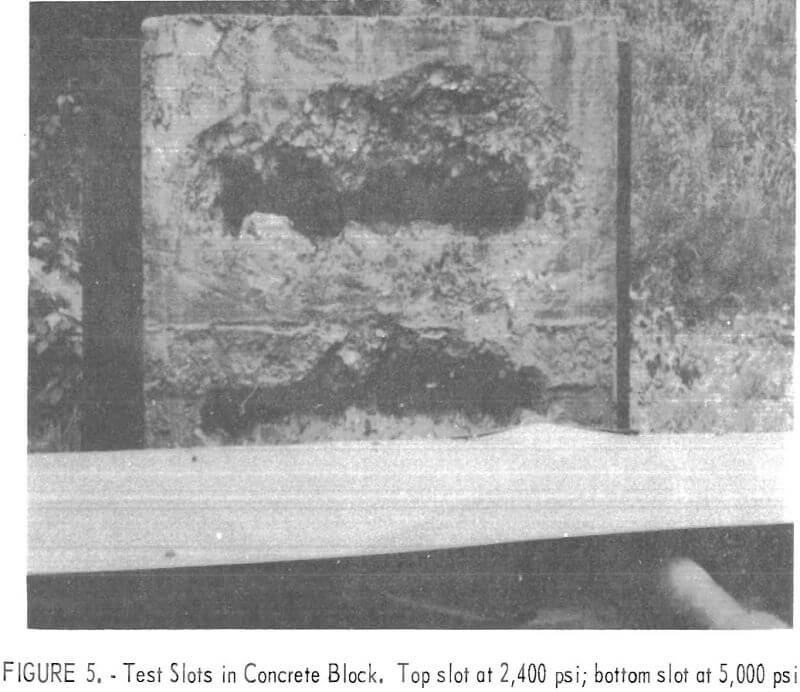
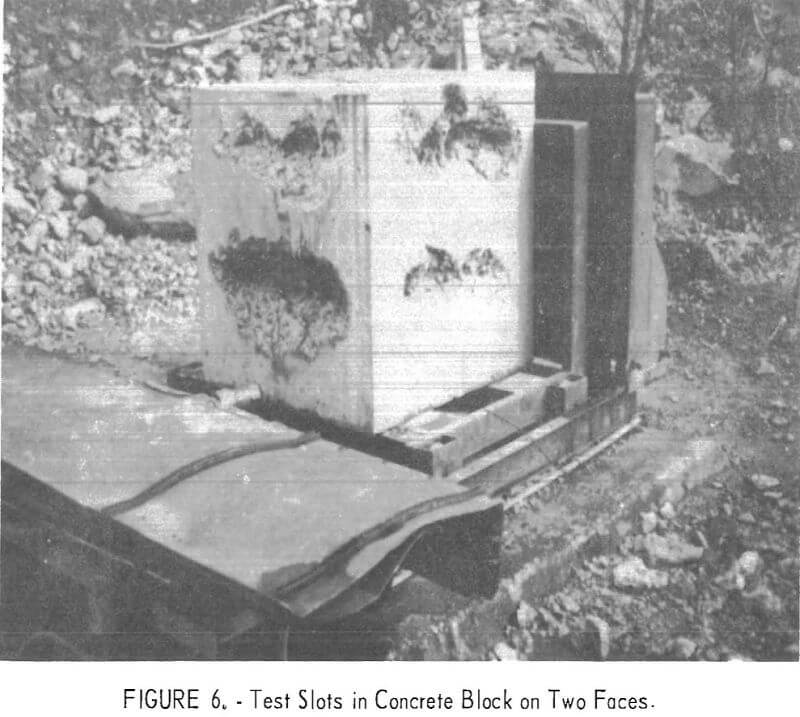
The monitor was then repositioned with the same parameters as in the previous test, and another test run was made. After two test runs under the same conditions, the monitor was moved to a different part of the block and a new test series was started (figs. 5 and 6).
The 22-in. distance traversed across the face of the block allowed the monitor to be placed so that the slot was contained entirely within the face of the block. Whenever the edges of the block were damaged, by breakage or otherwise, the run was abandoned, and a new test run was made.
Computer Analysis
The computer program used to analyze the data was designed for standard statistical analysis of multiple regression and was capable of handling a maximum of 140 observation variables. A wide variety of transformations could thus be made on the raw data. Two types of regression were available: direct and stepwise. In both regression analyses, a number of observations on a dependent variable Y and a series of independent variables, X, Xn, are present. Direct regression is the process of estimating the regression of Y on the X’s.
The stepwise regression at each stage selects the independent variable that determines the greatest variation in the dependent variable. The first independent variable selected is the one which determines the greatest variation in the dependent variable. The program then identifies the other independent variable showing the greatest variation in the dependent variable and in the second step adds this independent variable to the equation. Other steps in the regression follow an exactly similar procedure.
The significant levels of adding or removing a variable were determined by the probability constant or confidence level indicated in the regression parameters. In this analysis, a confidence level of 95 percent was used. A variable was added if its confidence level was greater or equal to 95 percent; if the addition of a variable was not significant at this confidence level the variable was not added. The removal of a variable from the equation occurred if the addition of a new variable to the equation reduced the significance of one of the variables present.
Design of Experiment
The experiment was performed using a 3 x 3 x 3 x 2 x 2 factorial design. Five factors were used: pressure (X1), standoff distance (X2), impact angle (X3), traverse time (X4), and the test surface condition (X5). Pressure, standoff distance, and impact angle were at three levels, and traverse speed and surface condition were at two levels. The five factors and their levels are given in table 2.

The 90° impact angle describes the perpendicular attack of the jet against the block; the 102.5° impact angle means that the jet was leading by 12.5° in the direction of the traverse; and an impact angle of 77.5° means that the jet was lagging by 12.5° in the direction of the traverse. The test surface condition “smooth” was applicable to the odd-numbered test runs, where
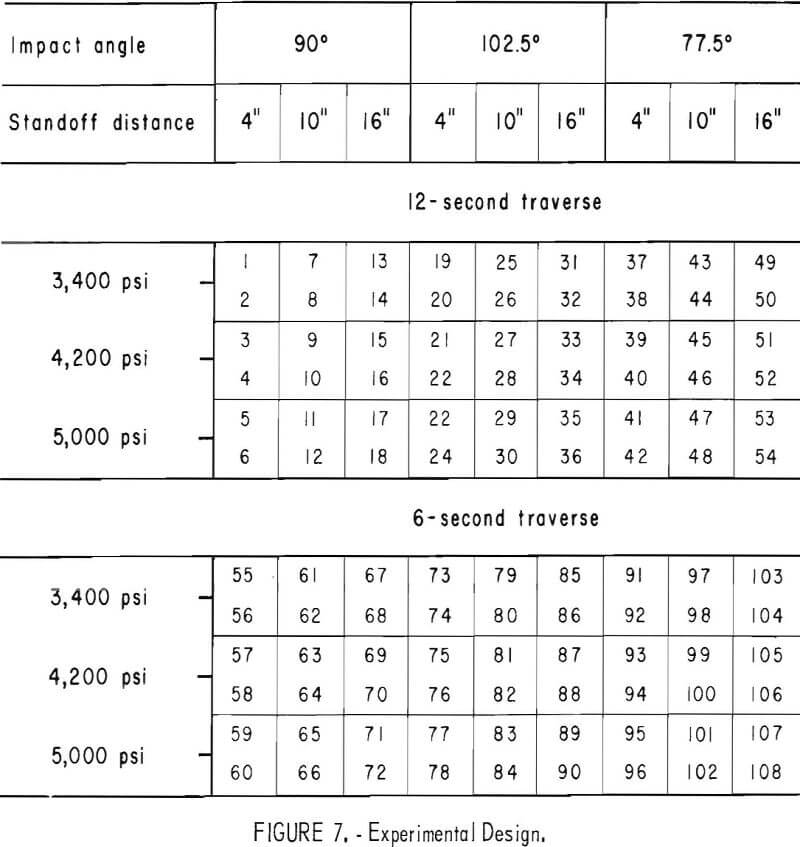
a fresh, smooth surface was the test area, and the test surface condition “rough” was applicable to the even-numbered test runs, where a rough, cut surface was the test area.
The factorial design included 108 test runs for each commercial strength of concrete. Two test runs were made under the same conditions except for the surface conditions. The experiment was partially replicated to give a total of 698 test runs. The order of test runs on each commercial strength of concrete was randomly chosen. The factorial design is shown in figure 7.
Determination of Physical Properties
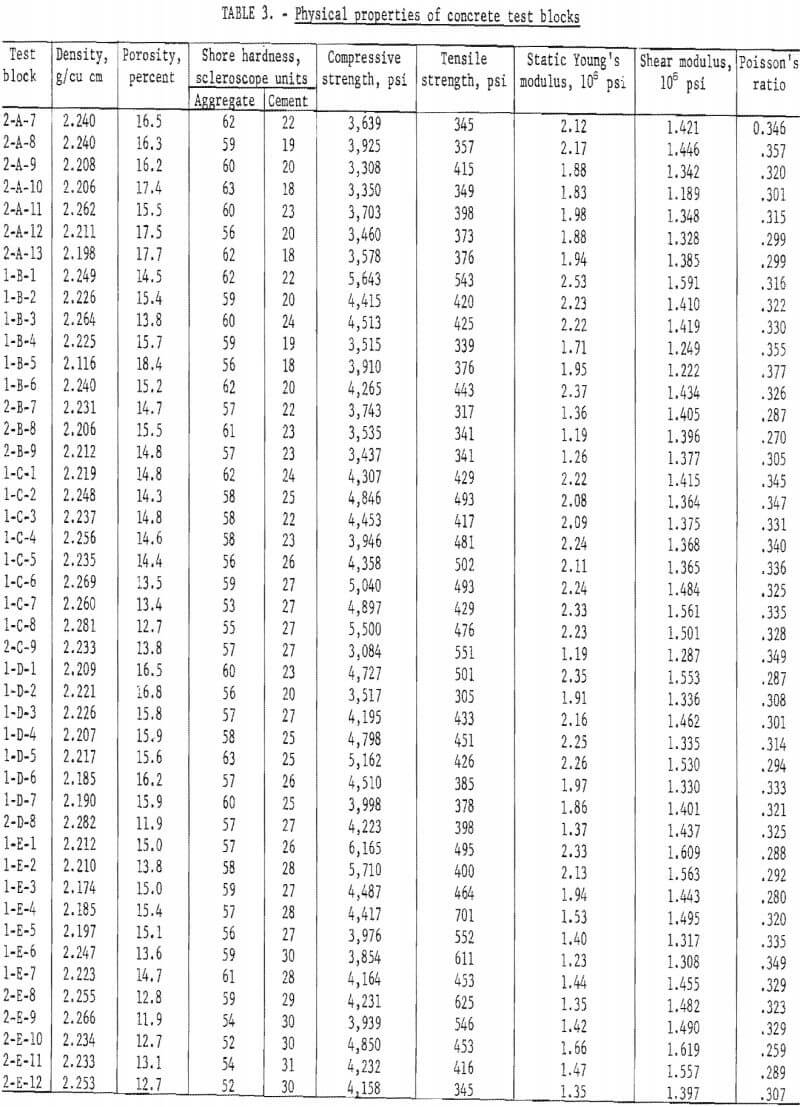
The physical properties of three specimens, a 6- by 12-in. cylinder and two samples from each block of concrete, were determined. These were density, porosity, aggregate hardness, cement hardness, Young’s modulus, compressive strength, tensile strength, dynamic shear modulus, and Poisson’s ratio. Table 3 shows the physical properties of the concrete blocks used in the experiment.
Treatment of Data
The statistical factorial design was used as a guide in making all observations. Pressure, standoff distance, impact angle, traverse time, and surface condition were fixed at specified levels. A model equation was set up for the analysis of data:
Yi = βo + β1X1 + β2X2 + βnXn
where Yi = the dependent variable,
Xi = the independent variables,
and βi = the desired regression coefficients.
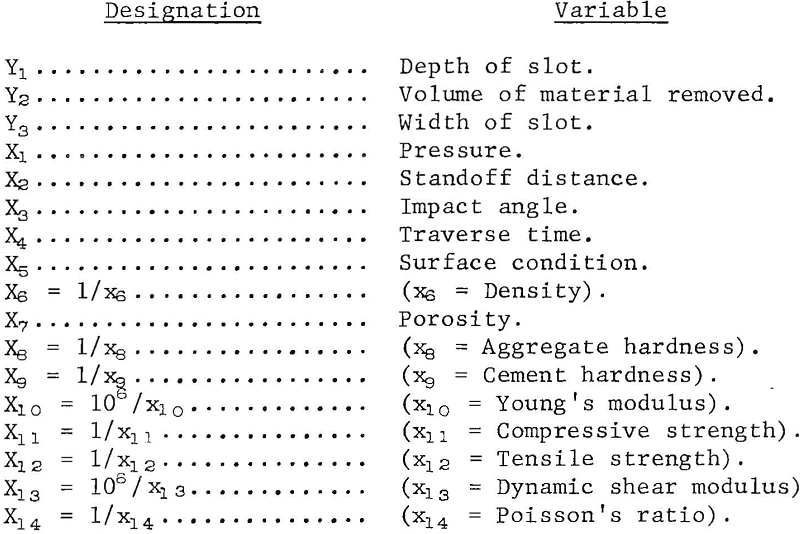
The numerical data of the factors of the factorial design (table 2) and the reciprocals, except for porosity, of the numerical data of the concrete properties (table 3) were used in the analysis. The reciprocals were used in the regression equations because this transformation gives an approximate linear relationship of the physical properties and the depth of penetration, volume of material removed, and the width of slot. The smooth surface condition was coded +1; the rough surface was coded -1. The variables studied in the analysis are summarized in the following tabulation.
Results of Analysis
The experimental data were grouped under three dependent variables: depth of penetration, volume of material removed, and width of cut. For each of these, a stepwise multiple regression equation at an approximate confidence level of 95 percent was developed to determine the significant independent variables. From these stepwise regression equations, 15 predictor equations were developed, five for each dependent variable, with the difference among them in terms of the independent variables.
Although regression equations based on other parameters, including the reciprocal of the standoff distance and the interactions of the factorial variables, were formulated, these either had small multiple correlations or their low gains in precision were offset by the cumbersome equations developed. Consequently, these are omitted.
No fractures were observed in the cuts and the areas around the cuts. Pieces of concrete disengaged during the test runs were thrown and scattered in an area 30 to 40 ft from the test site; therefore, no size distribution of the fragmented concrete was possible.
Depth of Penetration
The simple correlation coefficients of the significant variables in the stepwise multiple regression equations and the volume and width of slot in relation to the depth of penetration are shown in table 4. The table shows that, of the independent variables, pressure has the most significant effect on depth of penetration. Of the physical properties, the most significant is cement hardness. The correlation between the depth of penetration and the volume and width of the slot is good.
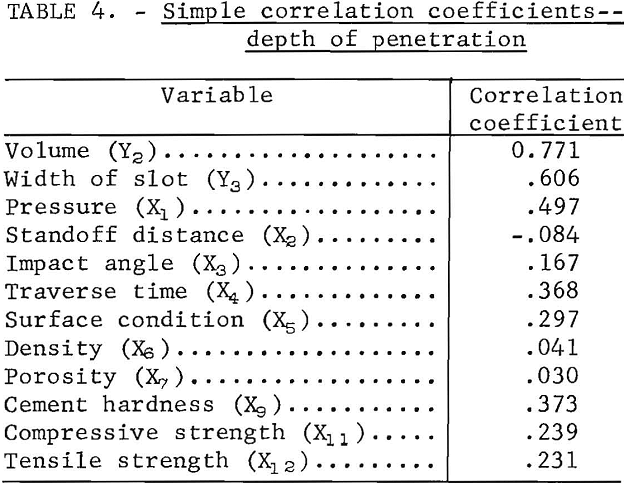
Table 5 shows the stepwise multiple regression analysis as it accepted or removed an independent variable. The table consists of multiple regression coefficient estimates, the F-level of accepting or removing an independent variable, the standard error of estimation of the equation, and the multiple correlation of each regression equation.
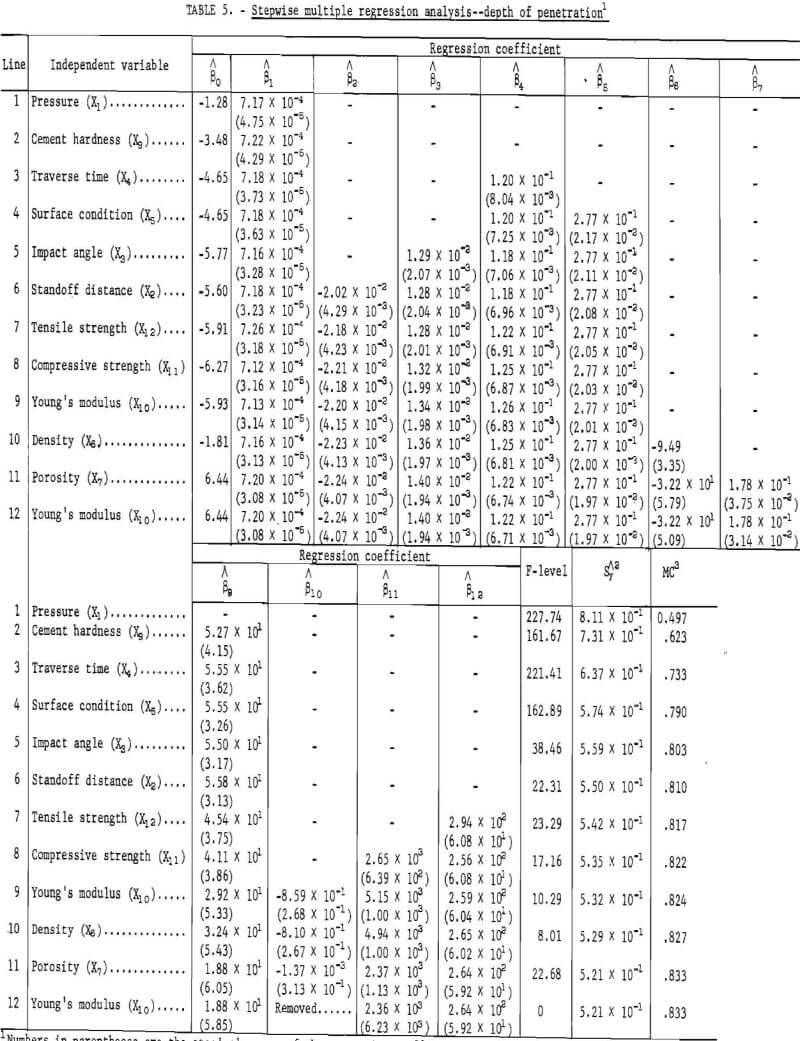
The first independent variable introduced into the regression line is pressure (X1). It is the one showing the highest correlation in table 4 and the one causing the greatest variation in the dependent variable. The table is then developed by adding, one at a time, other variables which, when fitted in combination with the previously determined variable, account for the greatest amount of variation in the dependent variable.
In regression line 11, the additional independent variable is porosity (X7). The presence of this variable causes the standard error of the regression coefficient estimate of Young’s modulus (X10) to become greater than the regression coefficient estimate, and in the next step, regression line 12, X10 is removed.
Each step of the program decreased the standard error of the predictor (Sy) until the significant level of 95 percent of adding or removing a variable was reached. Equation 12 is the most significant predictor equation for these data for the criteria used. The equation has a multiple correlation coefficient of 0,833 and a standard error of estimate of 0.521. In this equation, the significant variables are pressure (X1), standoff distance (X2), impact angle (X3), traverse time (X4), surface conditions (X5), density (X6), porosity (X7), cement hardness (X9), compressive strength (X11), and tensile strength (X12).
From this basic stepwise regression equation, five predictor equations were developed. These equations were developed so that the parameters of the jet and surface conditions could be preset, and thus, given one of the significant physical properties, one would be able to predict, within the scope and range of the data presented, the depth of penetration. The pertinent statistical parameters for the five predictor equations are given in table 6.
Table 6 shows the direct regression of the depth of penetration on each of the significant physical properties and the significant factorial variables. Equation 3, showing cement hardness as the physical property entered, has the highest multiple correlation, 0.810, the highest F-level, 219.72, the smallest standard error of estimate, 0.55, and the best correlation significance. All the predictor equations, however, are highly significant and may be used to predict the depth of penetration, given their respective physical property and parameter variables within the range of the data.
Figures 8 and 9 give a graphic representation of the parameters. Figure 8 shows the effect of the factorial parameters on the depth of penetration. Increases of pressure, impact angle, and time are matched by corresponding increases in depth of penetration, while an increase in standoff distance results in decreased depth of penetration. Figure 8C shows that the leading or 102.5° angle gives better penetration than either the lagging or normal angle. Figure 8E shows that if the surface is smooth (coded +1), the depth of penetration is greater than if the surface is rough and uneven.
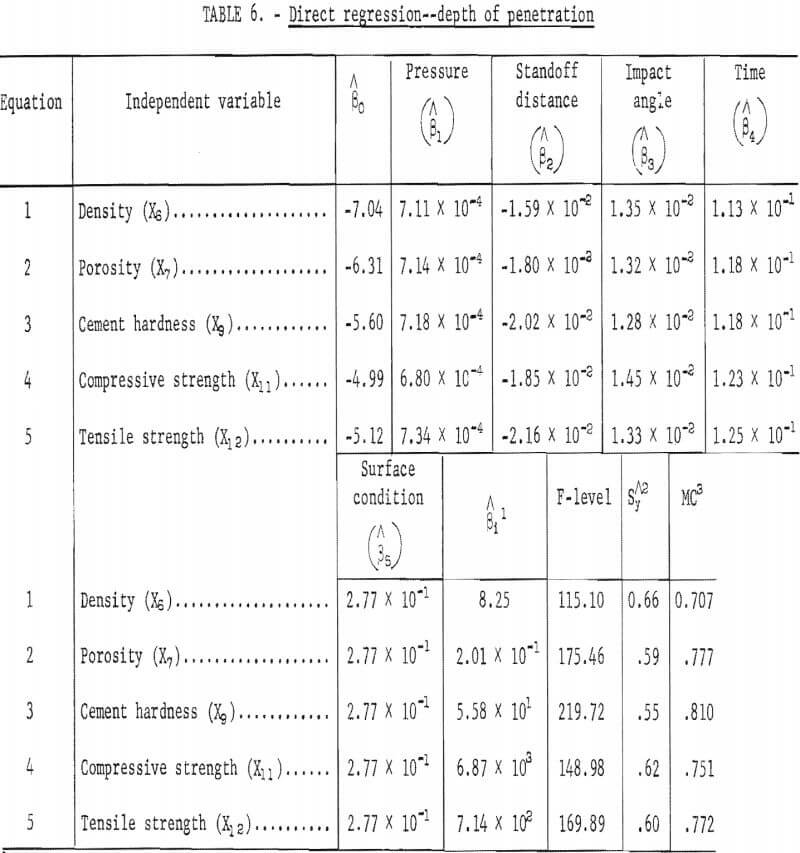
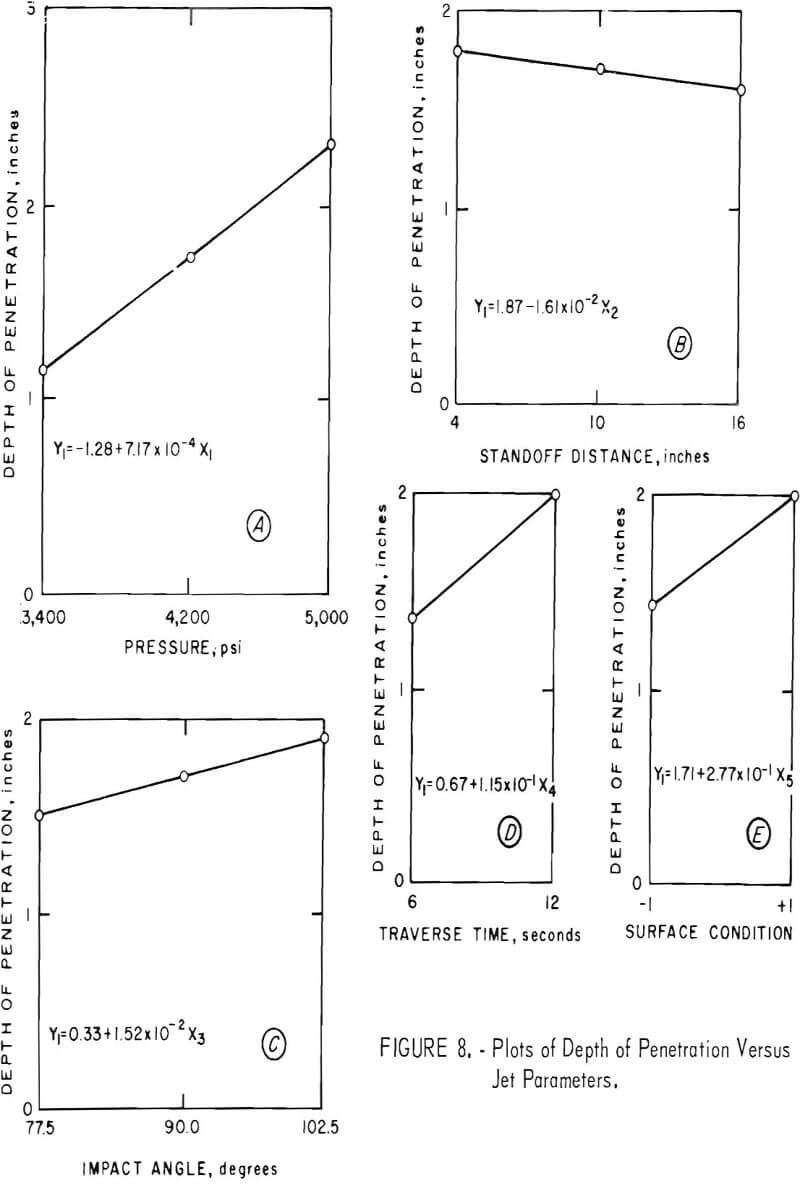
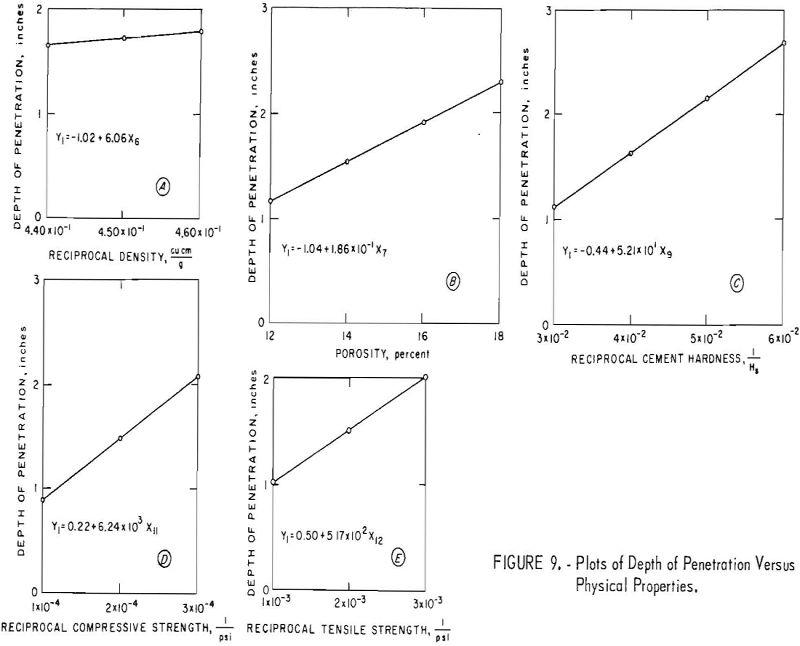
Figure 9 shows the effect of the significant concrete properties on the depth of penetration. An increase in porosity and increases in the reciprocals of density, cement hardness, compressive strength, and tensile strength result in increased depth of penetration.
Volume of Material Removed
The simple correlation coefficients of the significant variables and the depth of penetration and width of cut in relation to volume are given in table 7. The table shows that pressure, followed by traverse time, has the most significant effect on the volume of material removed. Porosity (X7) shows the best simple correlation coefficient of the rock properties. The correlation is good between the volume and the depth of penetration and the width of cut.
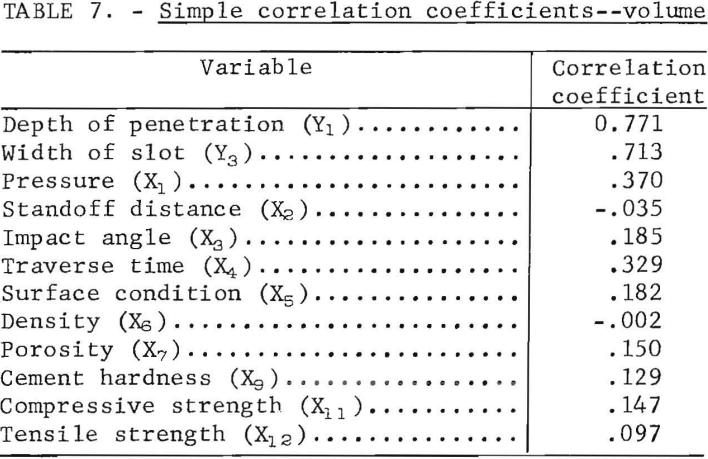
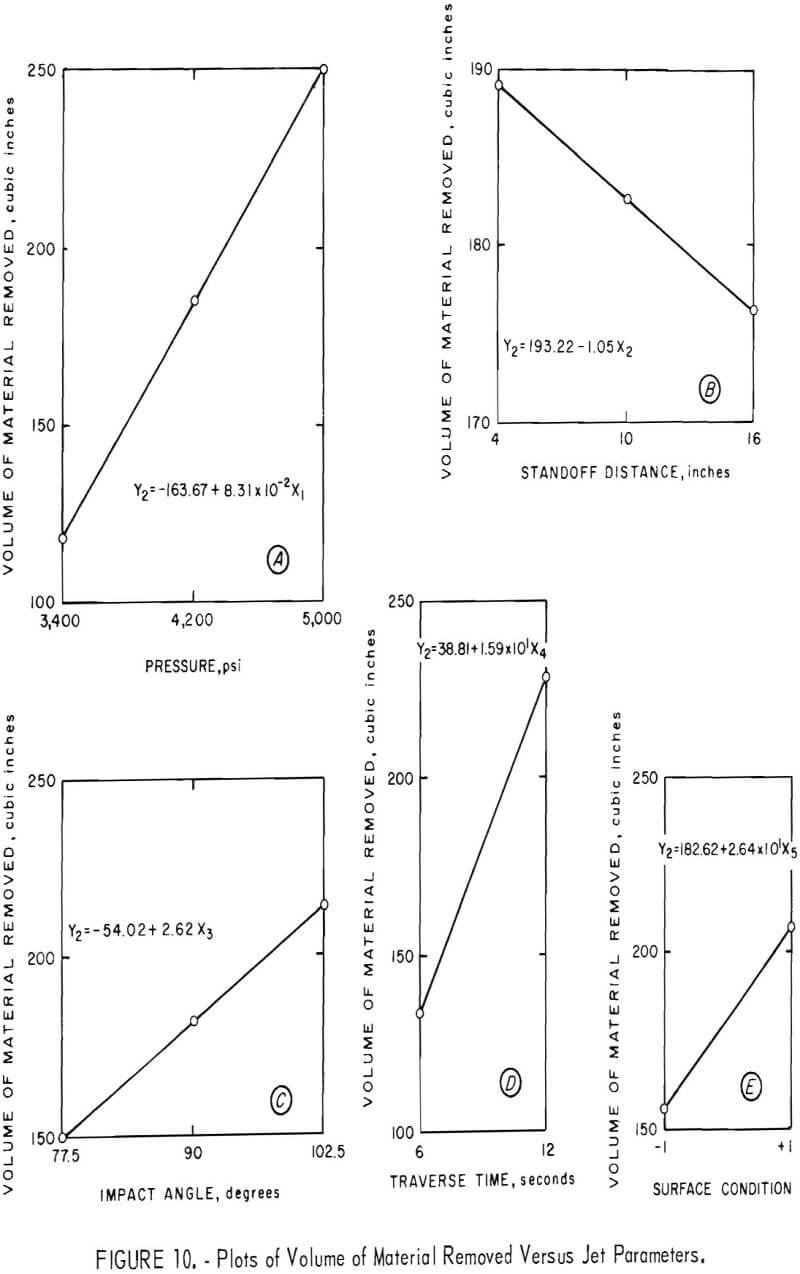
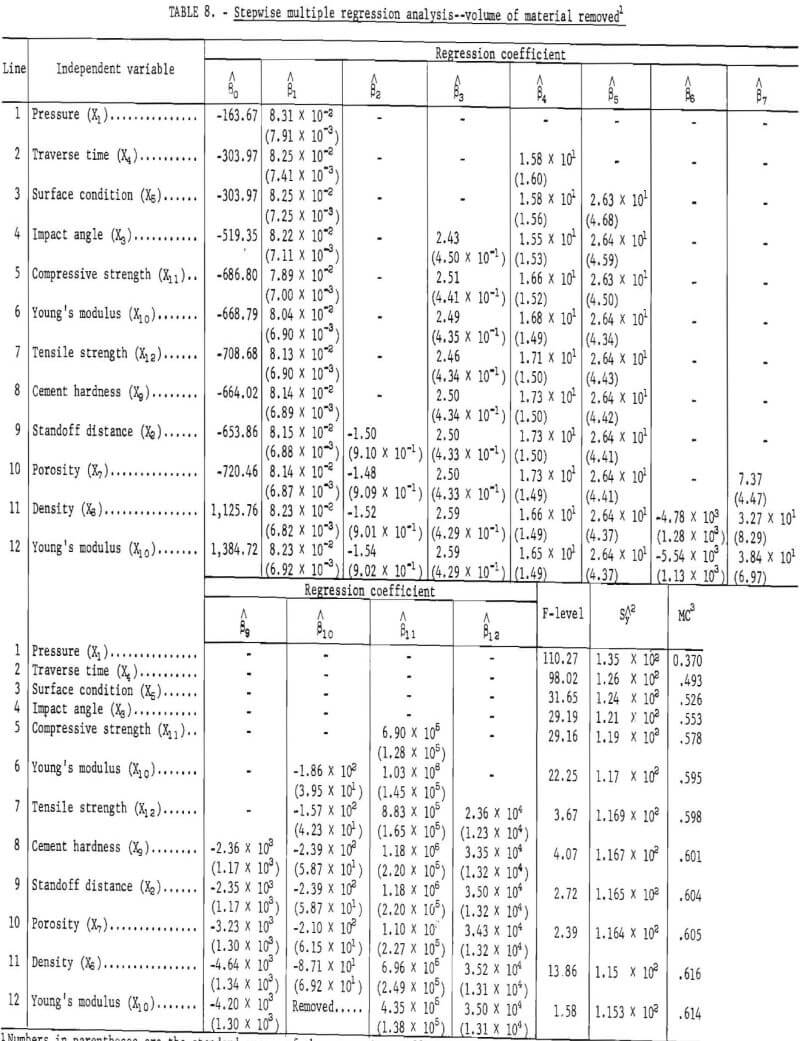
Table 8 shows the development of the multiple regression equation for the dependent variable volume. The first independent variable introduced is pressure (X1), which shows the highest correlation of the independent variable in table 7 and causes the greatest variation in the dependent variable. The table is then developed similarly to table 6.
In regression line 11, the addition of the independent variable density (X6) causes the standard error of the regression coefficient of Young’s modulus (X10) to approach the regression coefficient estimate, and in the next step, regression line 12, X10 is removed. Equation 12 is the most significant predictor equation for these data under the criteria used. The equation has a multiple correlation coefficient of 0.614 and a standard error of estimate of 1.153 x 10². Although the significant variables of this equation are the same as those in the equation for depth of penetration, their contribution to the variability was not the same, and they were entered into the regression analysis in a different order, except for pressure, which in both instances was the first variable introduced. The significant variables are pressure (X1), standoff distance (X2), impact angle (X3), traverse time (X4), surface condition (X5), density (X6), porosity (X7), cement hardness ), compressive strength (X11), and tensile strength (X12).
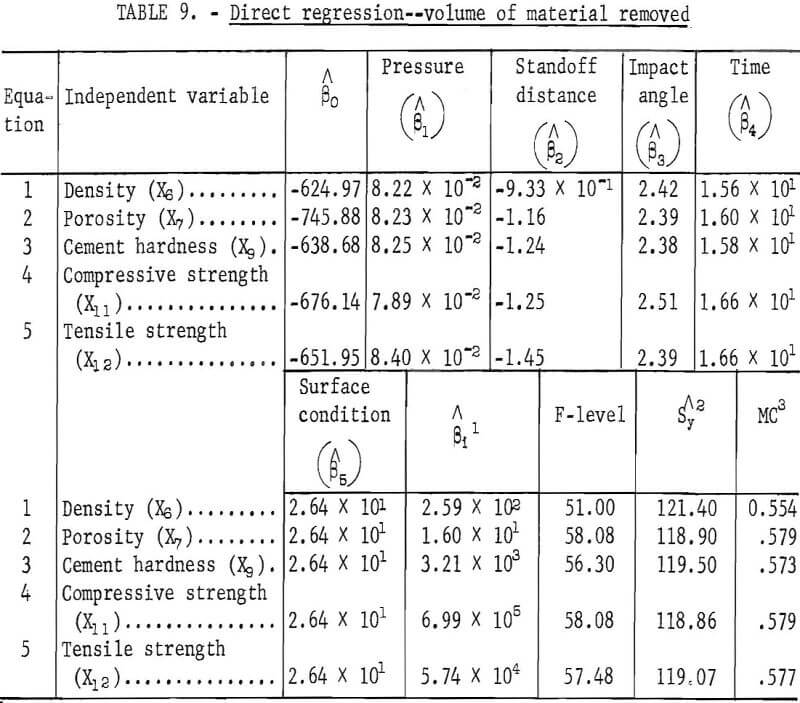
The five predictor equations developed from these data are given in table 9, which shows the direct regression of the volume of material removed on each of the significant physical properties and the significant factorial variables. These equations were developed so that the parameters of the water jet and surface condition could be preset, and thus, given one of the significant properties, one would be able to predict, within the scope and range of the data presented, the volume of material extracted. Equations 2 and 4, showing porosity and compressive strength, respectively, as the physical property entered, have the highest multiple correlations, 0.579, and the highest F-levels, 58.08, with the standard error of estimate for equation 2 as 118.90 and for equation 4 as 118.86. These show the best correlation significance. The remainder of the equations are also highly significant and may be used to predict the volume of material removed using their respective physical properties and parameter variables within the scope of the data presented.
Figures 10 and 11 show the parameters plotted on graphs. Figure 10 shows that increased pressure, impact angle, and traverse time increase the volume of material removed; that a smooth surface results in increased removal of material; and that an increase in standoff distance is accompanied by a decrease in volume of material removed. Figure 11 shows the effects of the physical properties on the volume of material broken. An increase in porosity and increases in the reciprocals of cement hardness, compressive strength, and tensile strength show an increase in volume of material removed, while an increase in the reciprocal of density shows a slight negative slope for a small decrease in volume of material removed.
Width of Slot
The simple correlation coefficients of the significant variables and the depth of penetration and volume in relation to width of slot are given in table 10. The table shows that, of the independent variables, surface condition has the most significant effect, followed by traverse time and pressure. The concrete properties appear to be less significant than the factorial parameters of the jet. There is good correlation between the width of the slot and the depth of penetration and the volume.
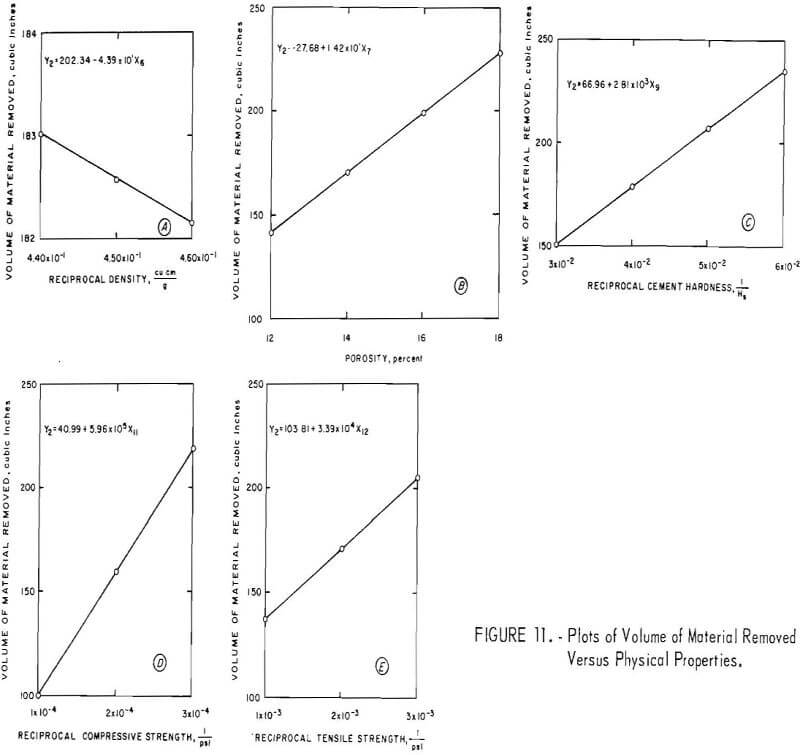

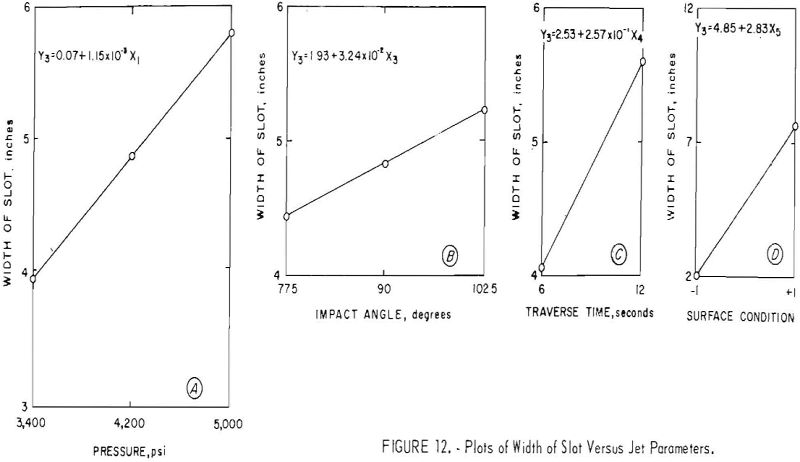
Table 11 shows the multiple regression analysis as it developed for an approximate confidence level of 95 percent. The first independent variable, surface condition, introduced into the regression line shows the highest correlation in table 10 and the greatest variation in the dependent variable. There are nine regression lines in this table, and there is no deletion of any of the entered variables. Equation 9 is the most significant predictor equation for these data under the criteria used. The equation has a multiple correlation coefficient of 0.720 and a standard error of estimate of 2.98. The same significant variables are present as in the equations for depth of penetration and volume except standoff distance (X2) and Young’s modulus (X10), which never enter the analysis for width of slot. The significant variables are pressure (X1), impact angle (X3), traverse time (X4) , surface condition (X5), density (X6), porosity (X7), cement hardness (X9), compressive strength (X11), and tensile strength (X12).
The five predictor equations in table 12 developed from these variables show the direct regression of the width of slot on each of the significant physical properties and the significant factorial variables. These equations were developed so that the parameters of the water jet and surface condition could be present and thus, given one of the significant physical properties, one would be able to predict, within the scope and range of the data presented, the width of the slot. All of these equations are significant and may be used to predict the width of slot according to the respective physical properties and factorial variables within the scope of the data presented.
Figures 12 and 13 show the parameters plotted on graphs. Figure 12 shows that increased pressure, impact angle, and traverse time are accompanied by an increase in width of slot and that a smooth surface gives a wider slot than a rough, uneven surface.
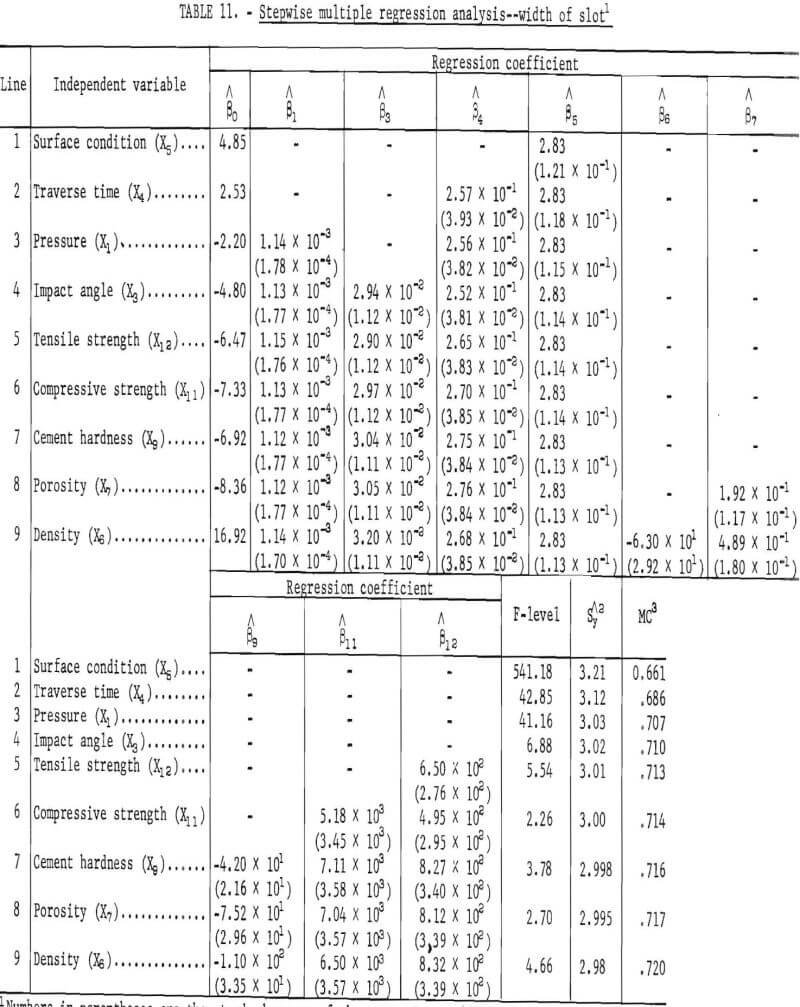

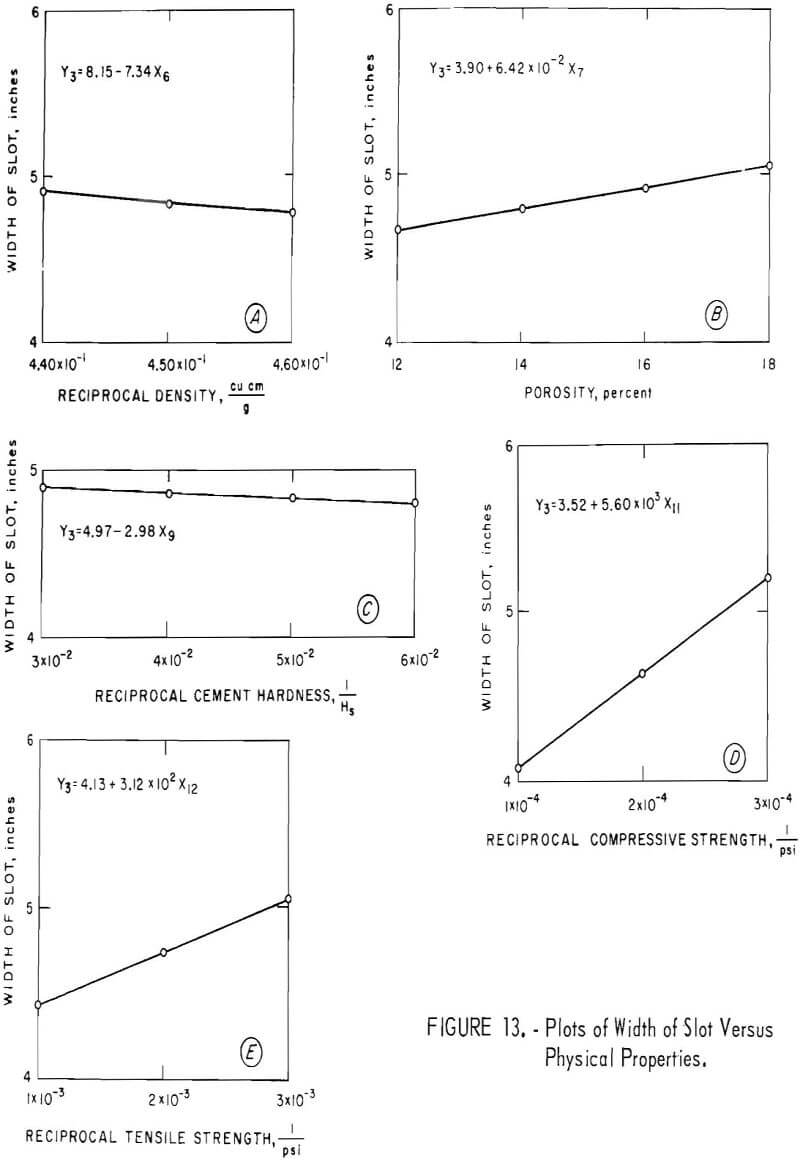
Figure 13 shows the effect of the physical properties on the width of slot. Porosity and the reciprocals of compressive strength and tensile strength are directly related to width of slot, and the reciprocals of density and cement hardness are inversely related to width of slot.
Energy Efficiency
Energy efficiency is defined as the volume of rock removed per unit of energy. This concept is a useful measure of the efficiency of a rock breakage system. Energy efficiency varies with the parameters of a given rock breakage system. It is the reciprocal of specific energy, which has been used in hydraulic research.
Maurer used specific energy to compare various rock-breaking techniques. In his research specific energies ranged from 4 to 10 j/cu cm for blasting (energy used in drill holes not included) up to 5,000 j/cu cm for rotary diamond drills. An erosion, or water jet, drill with nozzles 3 to 5 mm (0.118 to 0.197 in.) in diameter required 2,000 to 4,000 j/cu cm to drill sandstone. McClain and Christy reported that the minimum specific energies for single cuts in sandstone were approximately 500 j/cu cm; in limestone, 2,000 j/cu cm; and in granite, 5,000 j/cu cm.
Energy efficiencies were calculated for the overall experiment and the various water jet parameters used in the present study. The average energy efficiency for the complete experiment was 0.293 x 10 -7 cu ft/ft lb (1,630 j/cu cm). The highest energy efficiency obtained during the experiment was 0.144 x 10 -6 cu ft/ft lb (333 j/cu cm) on block 2-A-9 with the following jet parameters: pressure 4,200 psi, standoff distance 4.00 in., impact angle 102.5°, time 6.00 sec, and a ratio of jet pressure to compressive strength of 1.270. The lowest energy efficiency obtained was 0.118 x 10 -9 cu ft/ft lb (405,000 j/cu cm) on block 2-E-10 with the following jet parameters: pressure 3,400 psi, standoff distance 16.00 in., impact angle 90.0°, time 6.00 sec, and a ratio of jet pressure to compressive strength of 0.701.
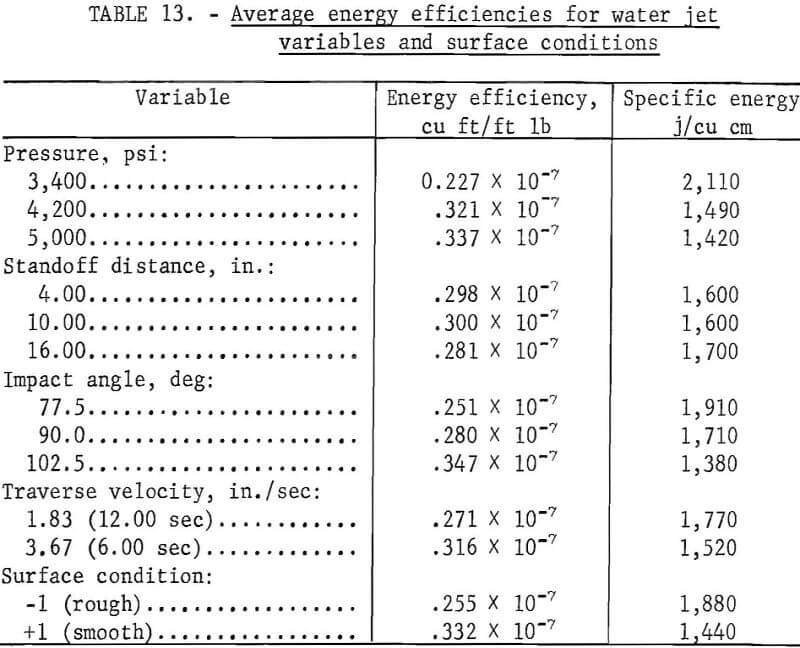
The average energy efficiencies at each level of the water jet variables and for the smooth and rough surfaces are given in table 13. In every instance, these calculations showed the same increasing or decreasing relation as the regression analyses showed (fig. 10) between volume of material removed and each variable. Increases in pressure, impact angle, and traverse velocity resulted in increased energy efficiencies. Increased standoff distance resulted in overall decreased energy efficiency; at 4.00 and 10.00 in., they were the same, perhaps because of the characteristics of the coherence of the jet at these distances. Energy efficiency was greater for a smooth, uncut surface than for a rough, cut surface.
Conclusions
The study successfully demonstrated the capability of water jets to break concrete. The relation of three variables — depth of penetration, volume of material removed, and width of cut to various water jet parameters and concrete properties was investigated. Regression equations were developed for each of these variables. The jet parameters and concrete properties correlated to depth of penetration and volume of material removed were pressure, standoff distance, impact angle, traverse time, surface condition, and porosity and the reciprocals of density, cement hardness (Shore scleroscope), compressive strength, and tensile strength. With the exception of the standoff distance, these parameters and properties showed a significant relation to width of slot. The multiple correlation factor for depth of penetration was 0.833; for volume of material removed, 0.614; and for width of slot, 0.720.
Five prediction equations for depth of penetration were developed from the significant jet parameters and one concrete property for each equation. Correlation factors ranged from 0.707 to 0.810, with the equation based on the jet parameters and cement hardness being the most efficient.
Five prediction equations for volume of material removed were developed from the significant jet parameters and one concrete property for each equation. Correlation factors ranged from 0.554 to 0.579. The equation based on the jet parameters and compressive strength was the most efficient, followed closely by the regression equation using porosity.
Five prediction equations for width of slot were developed from the significant jet parameters and one concrete property for each equation. Correlation factors ranged from 0.710 to 0.713. The equations based on jet parameters and tensile strength or compressive strength were the most efficient. All of the five prediction equations were very close in F-levels, standard errors of estimate, and multiple correlations.
Direct regression equations were developed for depth of penetration, volume of material removed, and width of slot as a function of each of the jet parameters and concrete properties. An increase in depth of penetration was directly related to an increase in pressure, impact angle, traverse time, porosity, smoothness of surface area and with increasing reciprocals of density, cement hardness, compressive strength, and tensile strength. Depth of penetration was inversely related to an increase of standoff distance.
The volume of material removed increased with increased pressure, impact angle, traverse time, porosity, smoothness of surface area and with increasing reciprocals of cement hardness, compressive strength, and tensile strength. The volume of material removed fell with increased standoff distance and the increasing reciprocal of density.
The width of slot increased with increased pressure, impact angle, traverse time, porosity, smoothness of surface area and with increasing reciprocals of compressive strength and tensile strength. Width of slot decreased as the reciprocals of density and cement hardness increased.
The results of the energy efficiencies calculated for the jet parameters indicated that increases in pressure, impact angle, and traverse velocity caused increases in energy efficiency; increases in standoff distance resulted in an overall decrease in energy efficiency; and a smooth, uncut surface resulted in a higher energy efficiency than a rough, cut surface. These results corresponded to those obtained in the regression analysis of the volume of material removed and the respective jet parameters.
Energy efficiencies were calculated for the overall experiment and various jet parameters. The average energy efficiency for the overall experiment was 0.293 x 10 -7 cu ft/ft lb (1,630 j/cu cm); the range of energy efficiencies was 0.118 x 10 -9 cu ft/ft lb (405,000 j/cu cm) to 0.144 x 10 -6 cu ft/ft lb (333 j/cu cm).
