Table of Contents
- Experimentation
- Results and Analyses
- Delivered Solids Concentration
- Data Presentation and Interpretation
- Mathematical Representation and Pipe Shape Factor
- Minimum Carrying Velocity
- Characteristics
- Determination and Comparison
- Head Loss
- Separation of Slurry Head Loss
- Comparison of Clear Water Head Loss Using Darcy’s Equation
- Comparison of Solids Head Loss Using Durand’s Equation
- Head Loss Ratio
- Solids Head Loss of Circular Pipe and Noncircular Pipe
- Reduction of Slurry Head Loss
Transporting solids in pipelines generally is considered economical in the mining industry as well as in other industries. For example, the procedure has been used successfully in the iron ore slurry pipeline of the Savage River mines and the coal slurry pipeline of the Black Mesa mines.
Even under conditions in which this mode of transportation is proving more economical than other conventional methods, research is continuing to improve its economy. Some research also has been conducted to clarify empirical formulas derived from earlier investigations.
Because the power requirement of a pipeline transportation system (indicated by head loss in the pipe) accounts for the largest operating expense, methods for reducing head loss have been investigated, Elata and Hoyt studied the effect of introducing polymers into slurries. Zandi tried the addition of particulate matter such as charcoal or clay. Wolfe investigated the effect of spiral currents generated by helical metal ribs installed inside a circular pipe. Chiu and Seman studied the action of secondary currents generated in square pipe. All these methods were found to be possible means of reducing head loss in slurry pipelines.
Among the novel methods for reducing head loss in slurry flow, only one used noncircular pipe. Prompted by the lack of data for noncircular configurations, the Bureau of Mines undertook an investigation using noncircular pipe for transporting solids. The experimental investigation of solid-liquid flow in noncircular pipes was concerned primarily with those variables known to characterize slurry flow; namely, transport velocity, solids concentration and head loss, or power requirement.
Experimentation
Solid Particles
The solid particles used in this study were spherical 14 by 16 U.S. standard mesh glass beads. The geometric mean diameter of the particles was 1.379 millimeters, the specific gravity was 2.93, and the settling velocity was 19.64 centimeters per second.
Apparatus
Figure 1 is a diagram of the pipeline facility used. The pump was a 2- by 1-inch (2-inch intake and 1-inch outlet) rubber-lined centrifugal sand
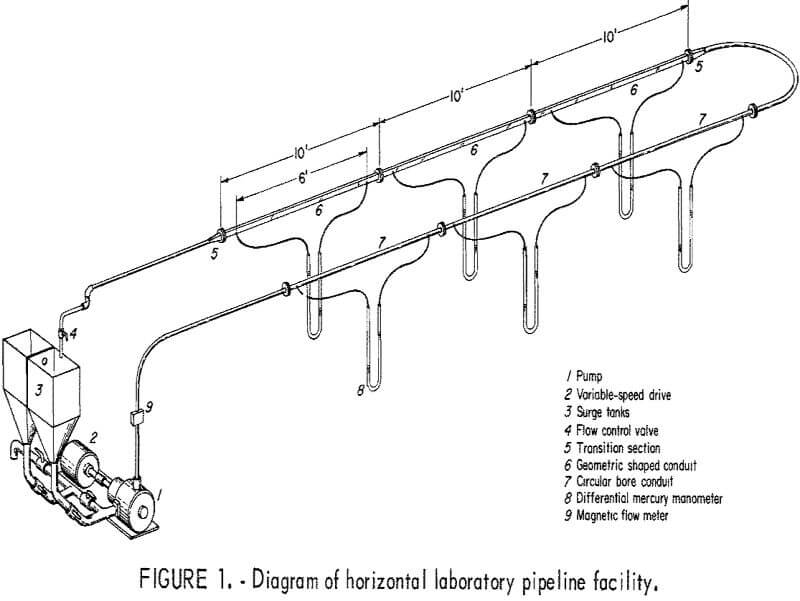
pump capable of producing a head of 120 feet of water at 1,920 rpm. The pump was driven by a 5-horsepower motor. A variable-speed control driven by a V-belt provided a speed range of 716 to 2,150 rpm. With this drive, flow rates could be achieved without using the throttling valve in the system; however, for very low flow rates, partial closing of the valve was necessary.
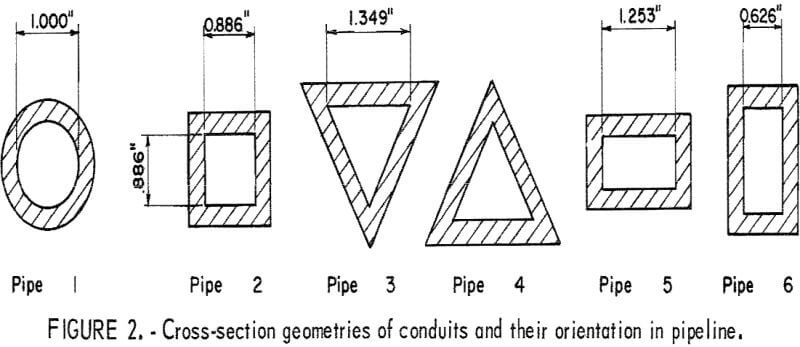
The smooth circular conduit used to establish reference data for comparison with noncircular pipes was installed as the outgoing leg of the loop. Test pipes with the same cross-sectional area but of different shapes were installed as the return leg. The different shapes used and their orientation in the system are shown in figure 2. The circular control conduit was 1-inch-ID commercial clear cast acrylic tubing. The other shapes were fabricated from ¼-inch sheet stock of the same material. A transition section allowed the slurries to flow smoothly from the circular pipe to pipe of a different shape.
Six manometers were installed in each test section to measure head losses. The tapping points were fitted with sediment bowls so that only water lay in the flexible plastic tubing between tapping points and the mercury differential manometers. A magnetic flowmeter, installed in the vertical leg of the pipeline, monitored and measured the apparent mean velocity of slurries continuously.
Experimental Procedures
For each conduit shape, water was circulated through the system to establish the hydraulic gradient. Then, the slurry was prepared by slowly adding a fixed weight of solids to the circulating water. This solid-water mixture was allowed to circulate long enough to distribute the solids uniformly throughout the pipeline. Once this equilibrium condition was attained, flow velocity and pressure drop were recorded, and a slurry sample was collected in a precalibrated container at the discharge end of the pipeline to determine the concentration of the delivered solids. This sample was returned to the system, and the test was repeated over a range of velocities. Three complete sets of readings were obtained at each velocity.
The slurry tests were conducted with a fixed weight of 6, 11, 19, or 30 pounds of solids that circulated through the system. The three samples
obtained for each flow velocity were averaged and classified in four groups with a 2.5-percent allowable deviation from the established median of 5, 10, 20, and 35 weight-percent. Additional points required to complete a head loss curve were obtained by adjusting the weight of solids in the system to produce the desired concentration. These procedures were repeated for each pipe shape.
Results and Analyses
Delivered Solids Concentration
Data Presentation and Interpretation
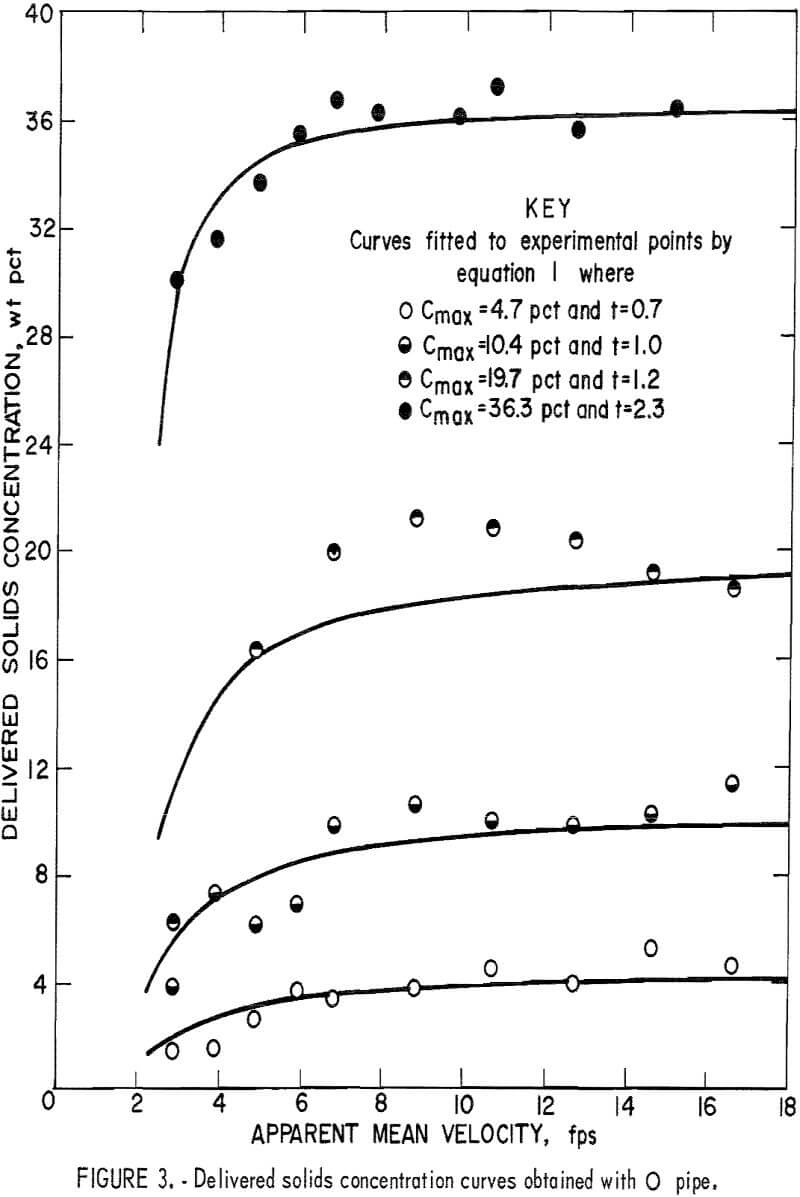
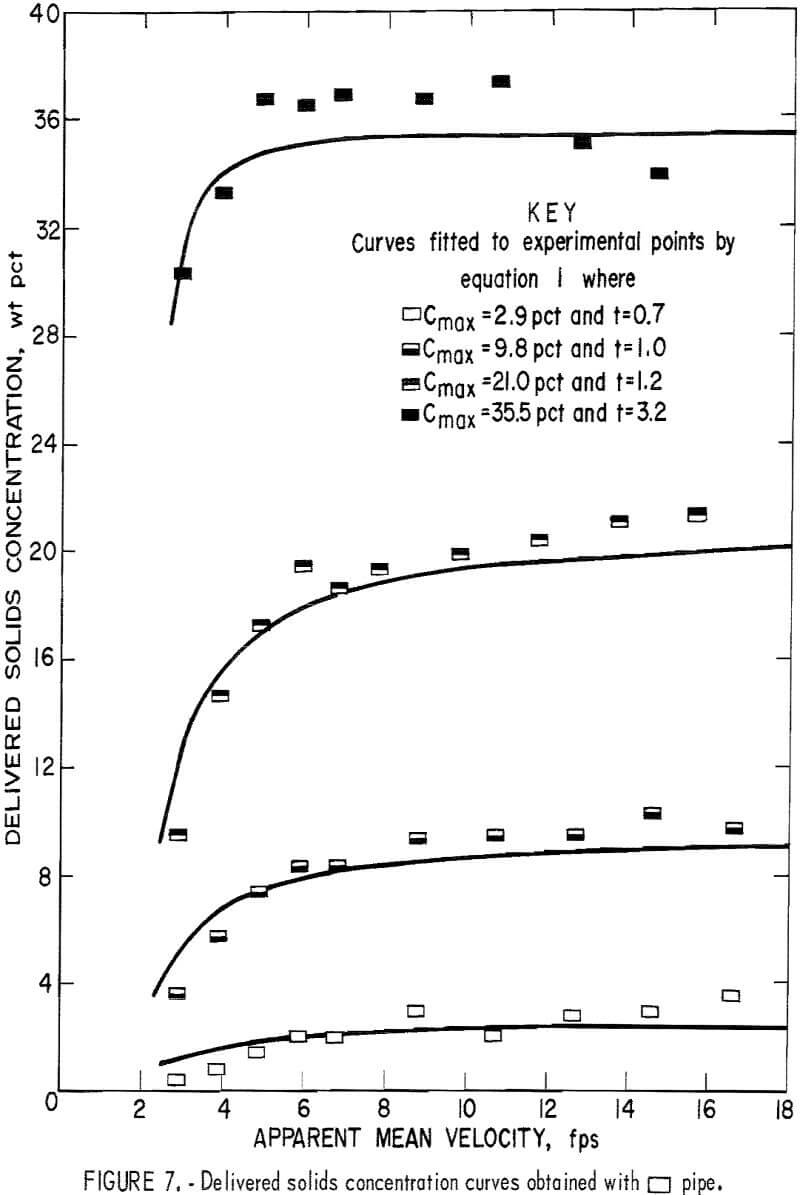
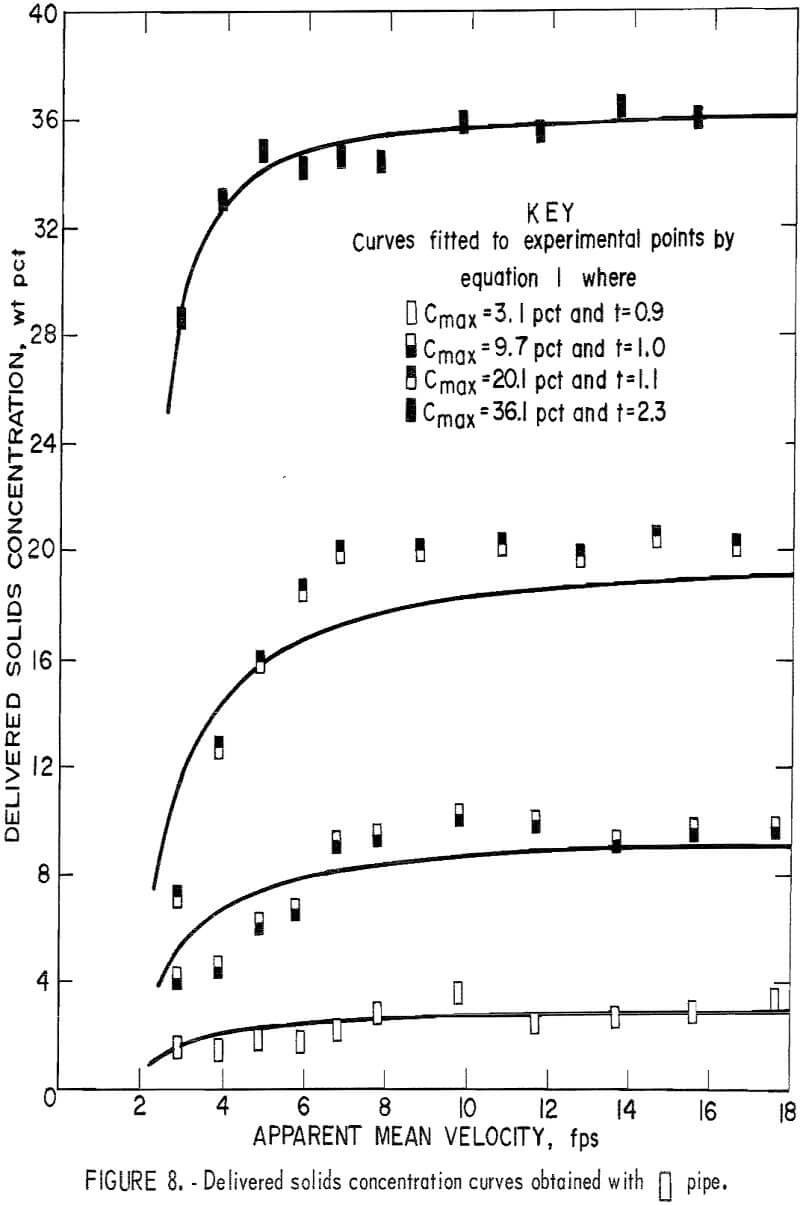
The data for delivered solids concentration obtained from the fixed weight tests for each pipe number are plotted in figures 3-8. In each figure
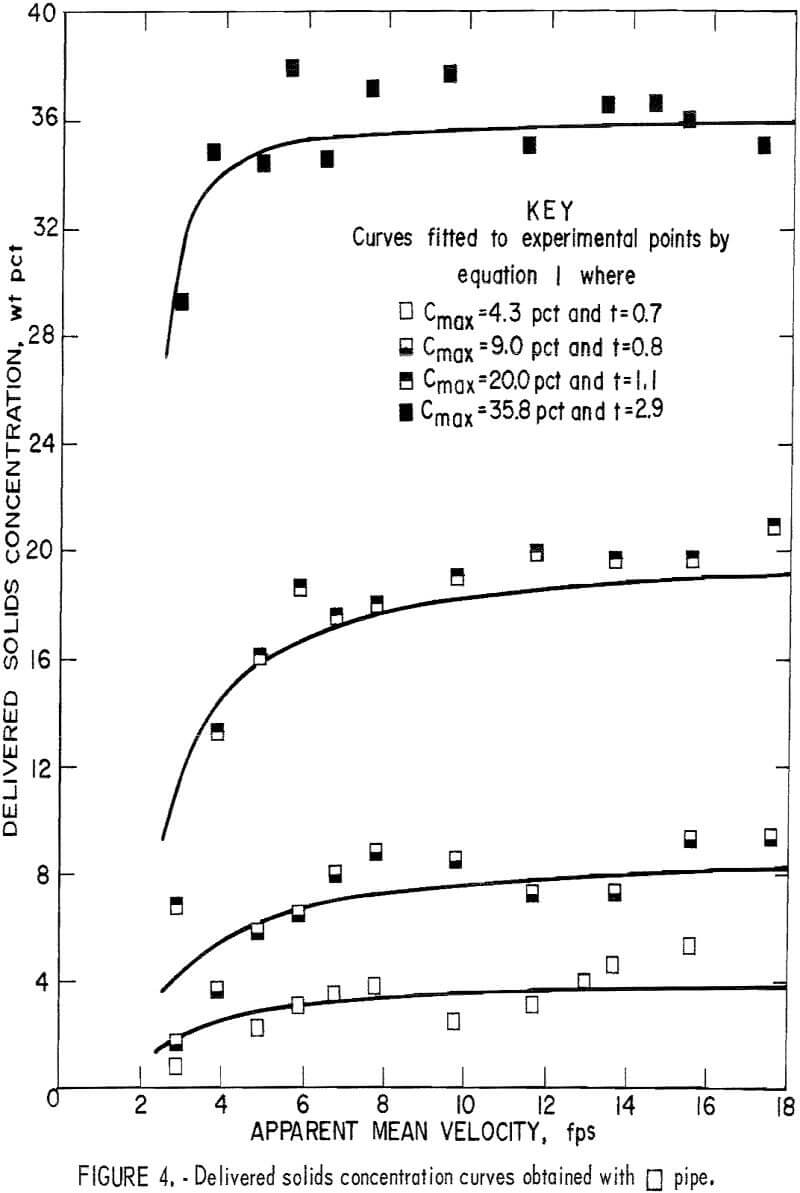
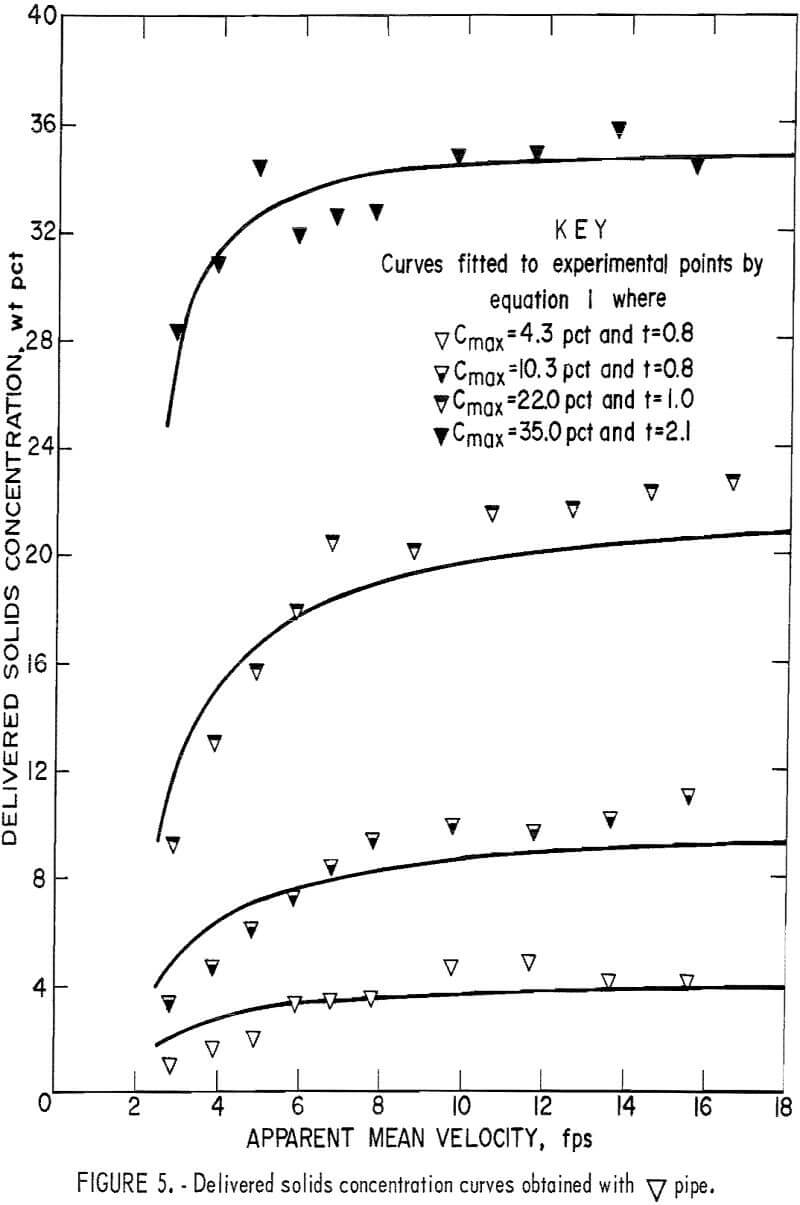
the four curves show the delivered concentration obtained with 6, 11, 19, and 30 pounds of solids in the system. At high velocities, the delivered concentrations remained approximately constant; they gradually decreased when the velocity was reduced and sharply decreased when the velocity fell below a certain point. This sharp drop was particularly pronounced at the higher concentration levels.
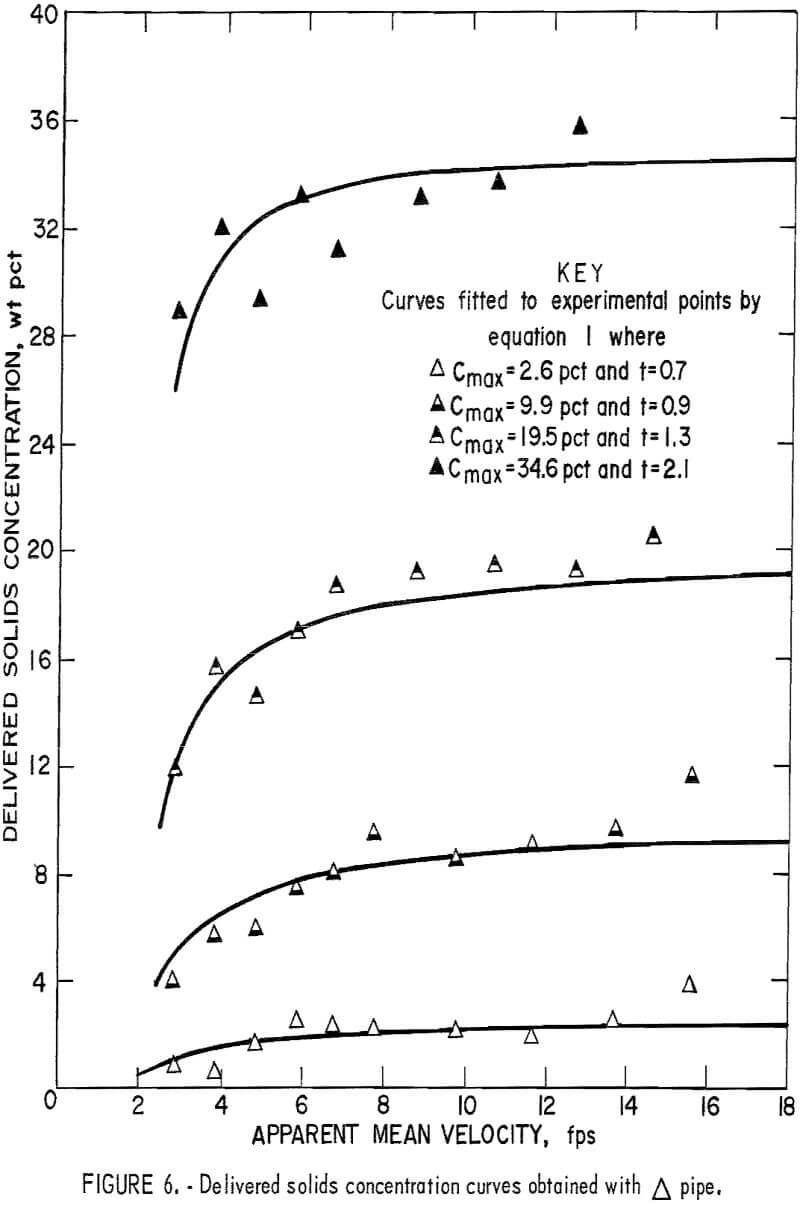
Because the weight of solids that circulated through the system was fixed and the distributive concentration of the solids throughout the pipeline was uniform and constant, the drop in the delivered concentration was attributed to a lag between solids and fluid velocities or a “material storage” inside the pipeline itself. This suggests that the fluid velocity relative to the solids velocity has a direct influence on the delivered solids concentration. Generally, delivered concentration decreases as the difference between the two velocities increases.
Mathematical Representation and Pipe Shape Factor
From a number of equations tested, it was found through curvilinear regression analysis that the general form of equation 1 best fits the data, as follows:

where Cmax is the expected maximum delivered solids concentration; theoretically, Cmax equals the solids distributive concentration in the pipeline when “storage” is zero, or the ideal delivered concentration when slip velocity
between solids and carrier fluid is zero. The particular velocity at which all solids in the pipe cease to move is represented by V0 ; in this investigation, V0 had the mean of 1.7 feet per second. Exponent t is a regression coefficient.
To determine the t value for each curve that best fits the data, a computer program was written to evaluate the standard deviations of assigned values until the minimum deviation was obtained. In this investigation, the average delivered concentrations obtained at test velocities above 10 feet per second were taken as Cmax. Optimal t values for each curve are shown in figures 3-8.
Plotting of the t values versus Cmax indicated that they have the general relationship
ln t = lnα + βCmax………………………………………………………(2)
However, the constants α and β are different for each pipe (table 1). Therefore, t value at a given Cmax is dependent on the pipe shape and is called the “pipe shape factor.”
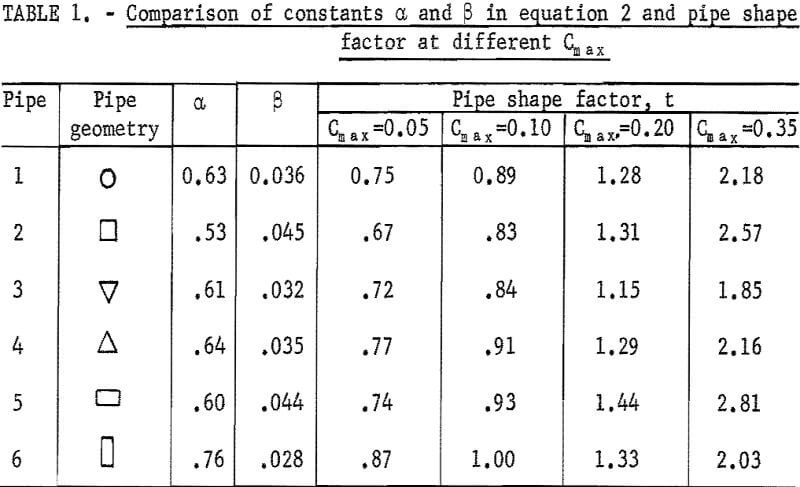
By substituting this pipe shape factor into equation 1, the Cdel becomes a known function of velocity, and the concentration curve now can be generated at any Cmax within the tested range. Several t’s were evaluated at Cmax = 0.05, 0.10, 0.20, and 0,35 for each pipe (table 1).
Minimum Carrying Velocity
Characteristics
Emphasis in the present study was on the critical point at which the delivered concentrations, as shown in figures 3-8, started to fall off considerably from the presumed constant level. This point indicates an important transition velocity called the “minimum carrying velocity” below which the solids no longer are carried efficiently by the fluid. This drop, owing to the lag of solids motion, can be considered as “storage” of solids in the pipeline in the form of a slowly moving bed or in the form of a stationary bed when the velocity is further reduced.
In the once-through system, if the operating velocity is below the required minimum carrying velocity, the actual delivered solids concentration at discharge will be less initially than that of the input solids concentration that is fed into the pipeline at a constant rate. This unequilibrium flow will continue until the storage requirement is satisfied. Then a new equilibrium condition is established in which the delivered solids concentration is equal to the input solids concentration. Such system balance is achieved because of the increase of the distributive concentration inside the pipeline. Hence, this increase restores the initial drop of delivered concentration owing to the velocity difference between solid and liquid phase.
Briefly, this minimum carrying velocity obtained from the delivered concentration test is defined as the minimum apparent mean velocity at which the average solid particles do not lag behind the fluid.
In 1964, Solovev reported an observation for pneumatic transport: “with a velocity less than the critical, the accumulation of particles will proceed until the gas velocity in the remaining effective cross section proves to be sufficient for transport of material.” Similarly, Condollos and Chapus found that “taking Vl as the critical deposit velocity, from the moment particles start to settle and the deposit builds up the flow velocity Ve in the free part of the pipe increases and adjusts itself such that
Vl/√g D = Ve/√4g Rh…………………………………………………..(3)
where D is the pipe diameter and Rh is the hydraulic radius of the free-flow section.”
Although the minimum carrying velocity and critical deposit velocity reported by other investigators are equally concerned with the particle settling phenomenon in the pipe, the minimum carrying velocity characterizes the onset of the formation of a moving bed flow, and the critical deposit velocity characterizes the beginning of a stationary bed buildup. In other words, the minimum carrying velocity is concerned with the material storage of a temporary nature, and the critical deposit velocity is concerned with the material storage of a permanent nature. To avoid the unstable floor condition, it is suggested that the flow velocity, particularly for long-distance pipelines, should be maintained at or above the minimum carrying velocity.
Determination and Comparison
To determine the minimum carrying velocity for a given Cmax, equation 1 is solved for V where t is evaluated by equation 2 and Cdel equals Cmax – ΔC. The ΔC is the assigned allowable drop in delivered concentration in the circulating system or can be regarded as an allowable increase of distributive concentration in the once-through system when the storage requirement is satisfied. The effect of the magnitude of pipe shape factor on the minimum carrying velocity at a given maximum delivered concentration is illustrated in figure 9, which indicates if t1 > t2 then Vm1 < Vm2.
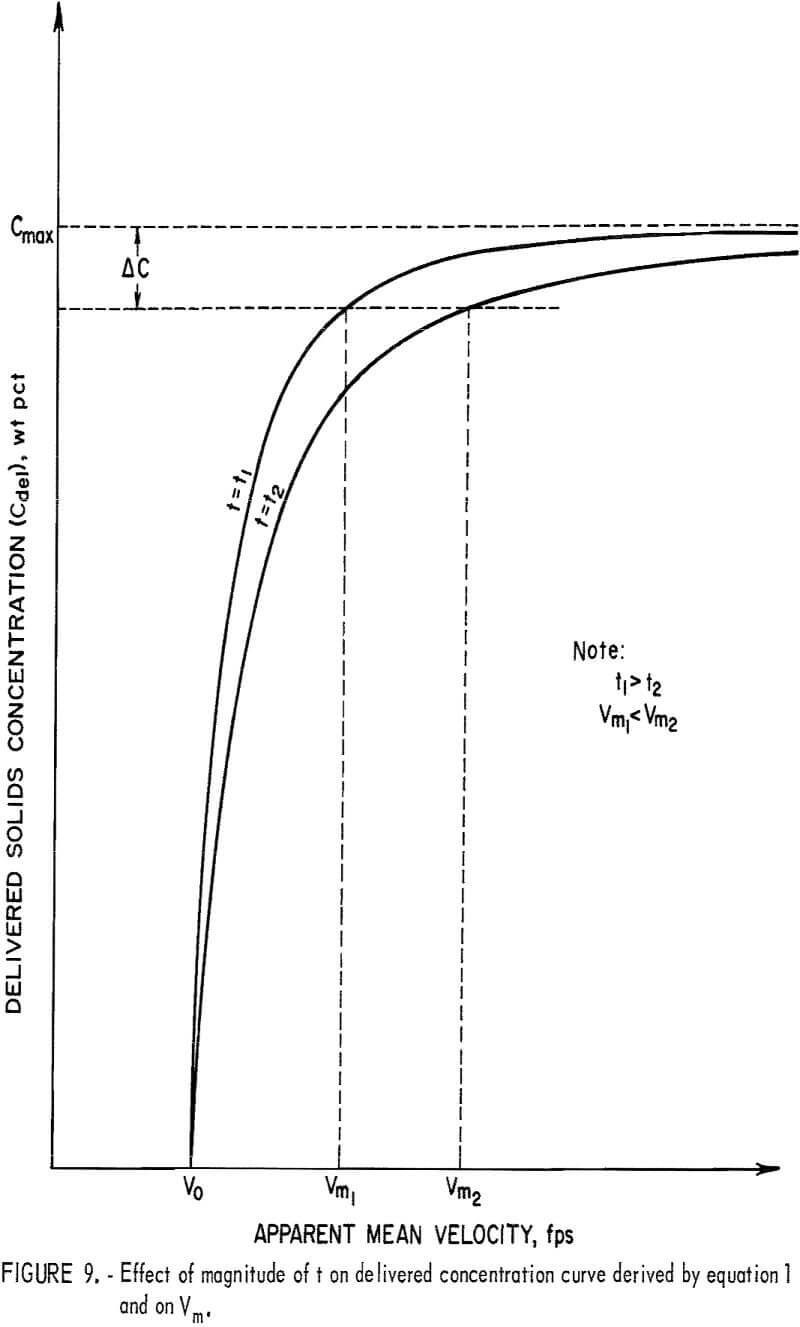
The pipe -with a lower Vm can be operated at such a low flow velocity with only an allowable material storage; if operated at the same velocity, the other pipes may have a considerable amount of storage that may even cause a blockage of the pipe, A lower operating velocity also may lead to a low head loss. Therefore, a pipe associated with a larger t in the concentration equation for a given Cmax is regarded as advantageous.
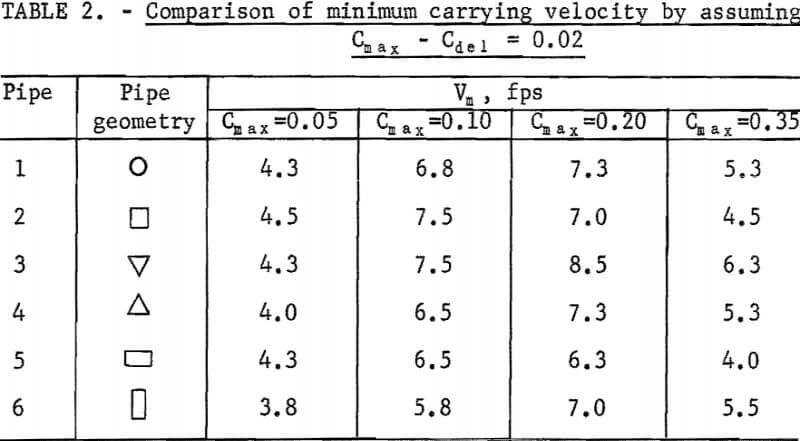
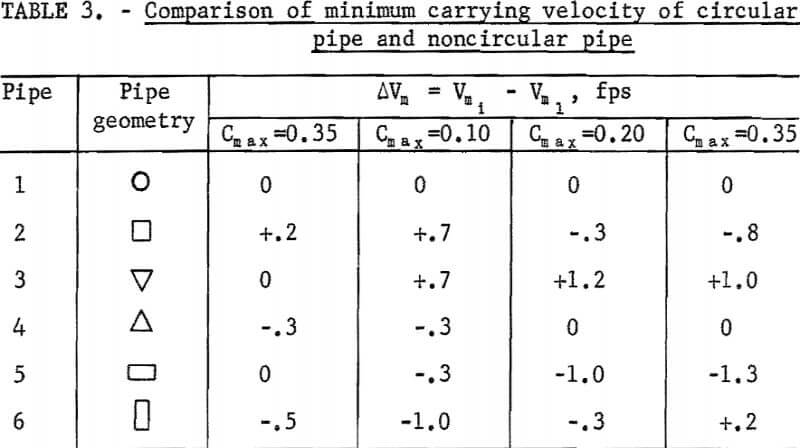
Based on the analysis shown in figure 9 and the t values shown in table 1, pipe 6 at 5 and 10 percent Cmax and pipe 5 at 20 and 35 percent Cmax have the lowest minimum carrying velocity. On the contrary, pipe 2 at 5 and 10 percent Cmax and pipe 3 at 20 and 35 percent Cmax have the highest minimum carrying velocity.
The significance of the difference of the minimum carrying velocity among all pipes is shown in tables 2-3. In table 2, the minimum carrying velocity was determined by assuming Cdel = Cmax – 0.02. In table 3, the difference of minimum carrying velocity between circular and noncircular pipe, Vm =Vmi – Vml was evaluated. The subscript i denotes the pipe number of the particular pipe that Vm represents, and Vml represents the circular pipe.
Head Loss
Separation of Slurry Head Loss
Although liquid flow is quite well understood, solid-liquid flows are more difficult to understand because of the complexity of the interaction between liquid and solids. However, the head loss for solid-liquid flow can be considered as the sum of the friction head loss for liquid alone plus the friction head loss caused by introducing solids.
The liquid used most frequently in slurry flow is water, but the transported solid varies. Figure 10 illustrates the general relationship between
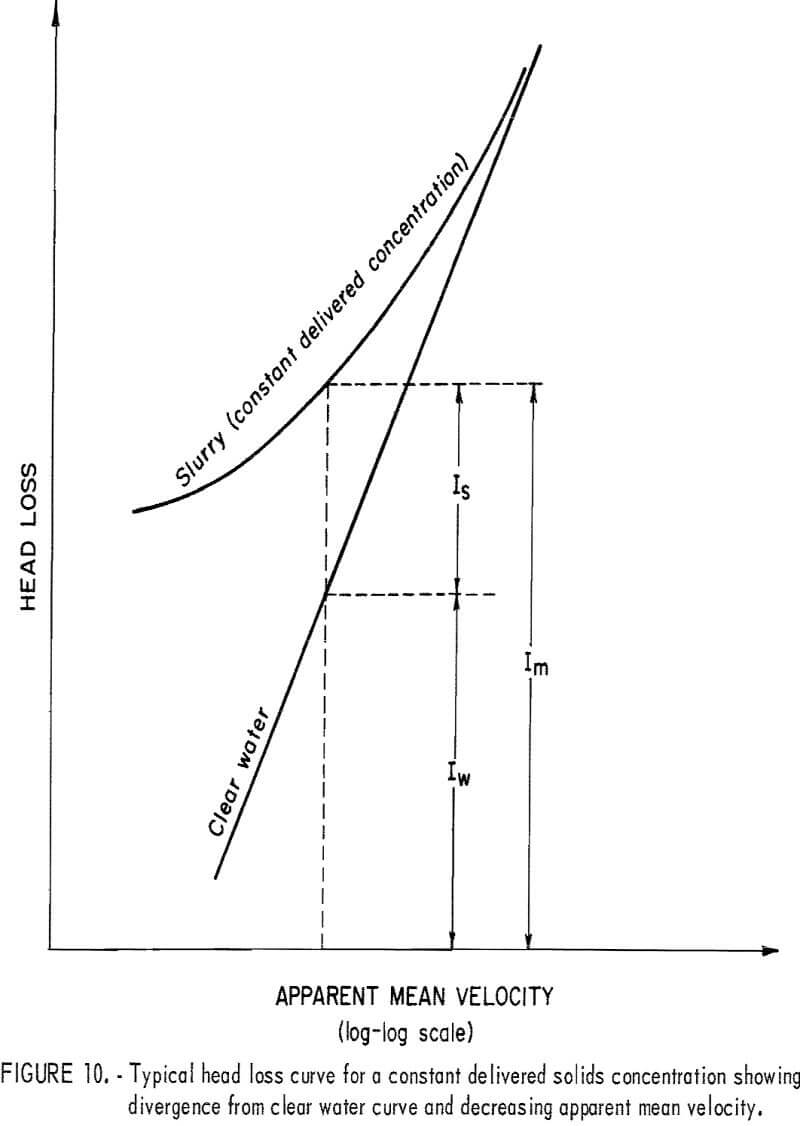
friction head loss and velocity. The curve represents the head loss for a solid-water mixture, im, at constant solids concentration; the straight line represents the head loss for clear water, iw. The difference, is, represents the head loss due to the presence of solids or “solids head loss.” To obtain a better understanding of the slurry head loss, it has been separated into iw and is and studied individually for each pipe.
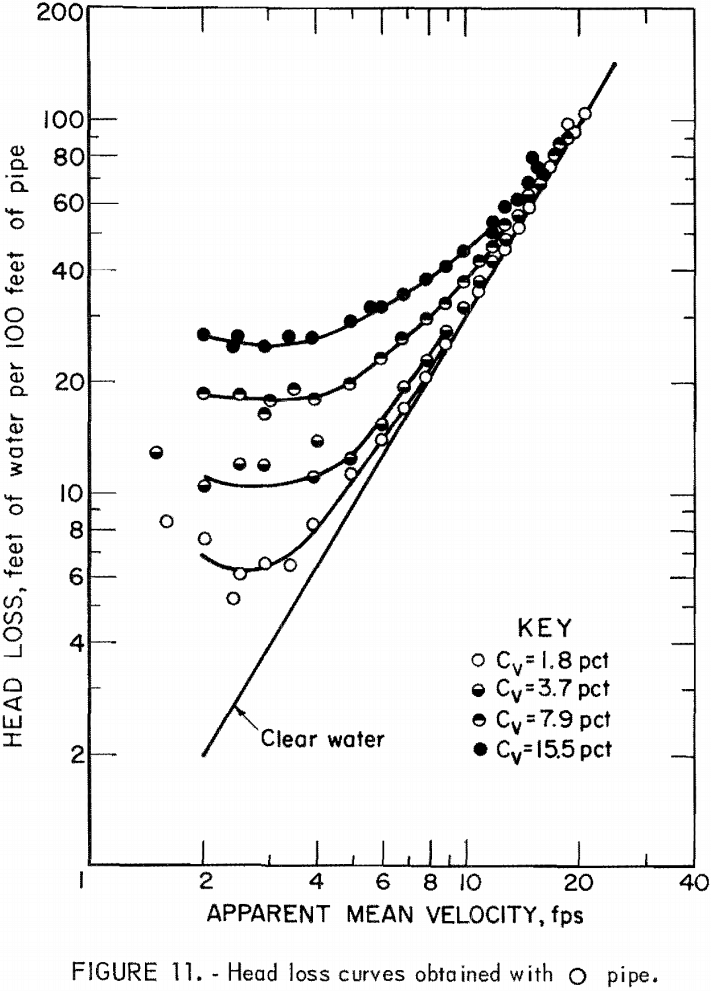
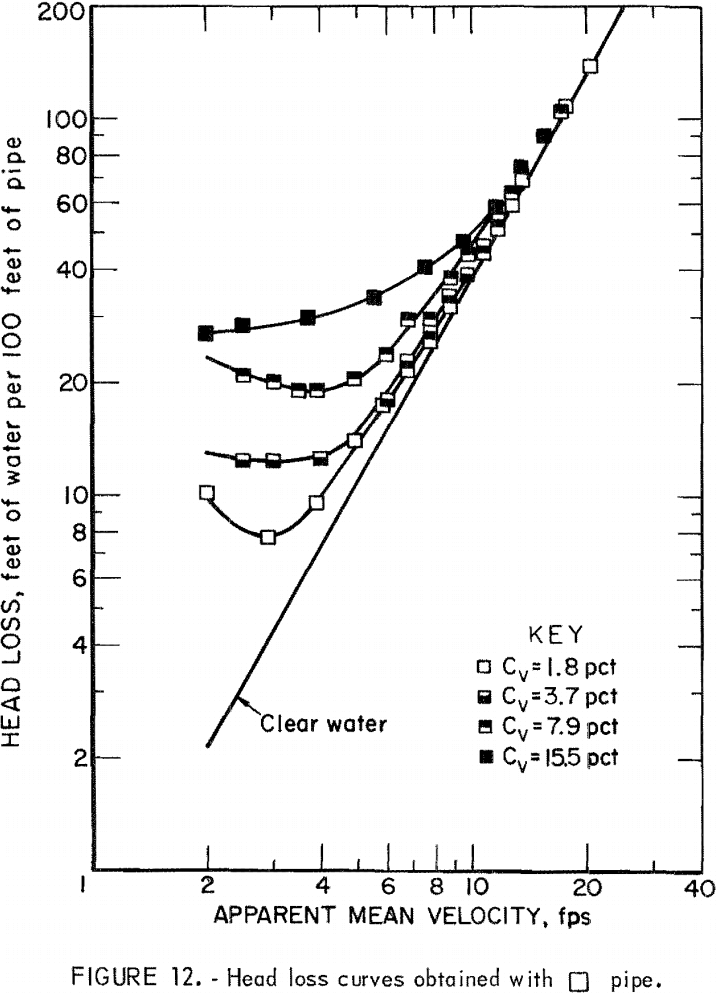
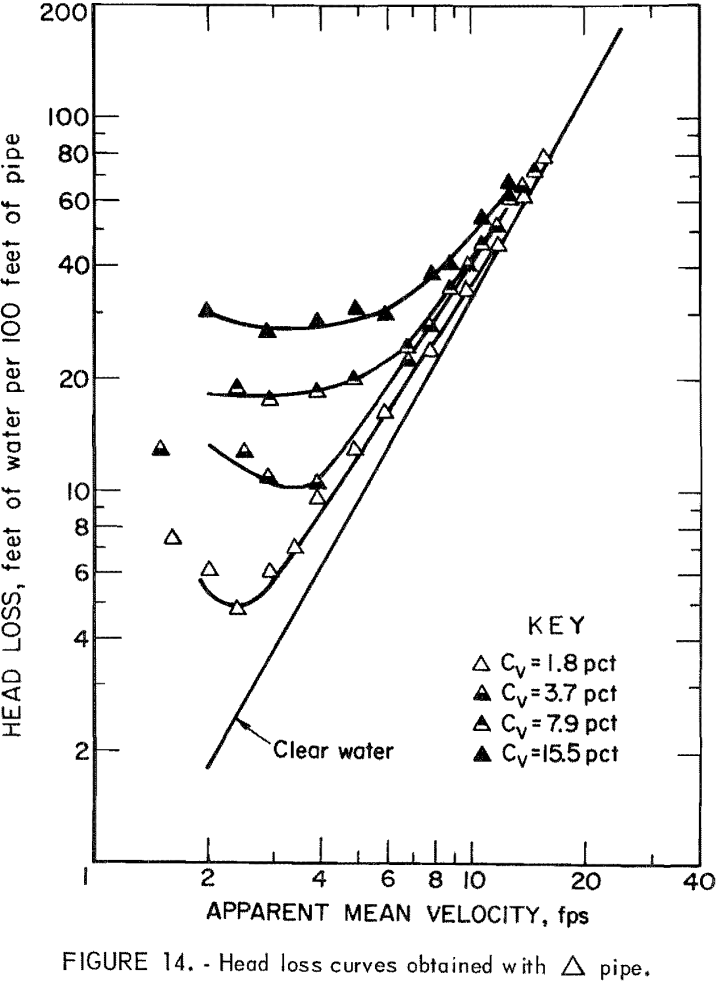
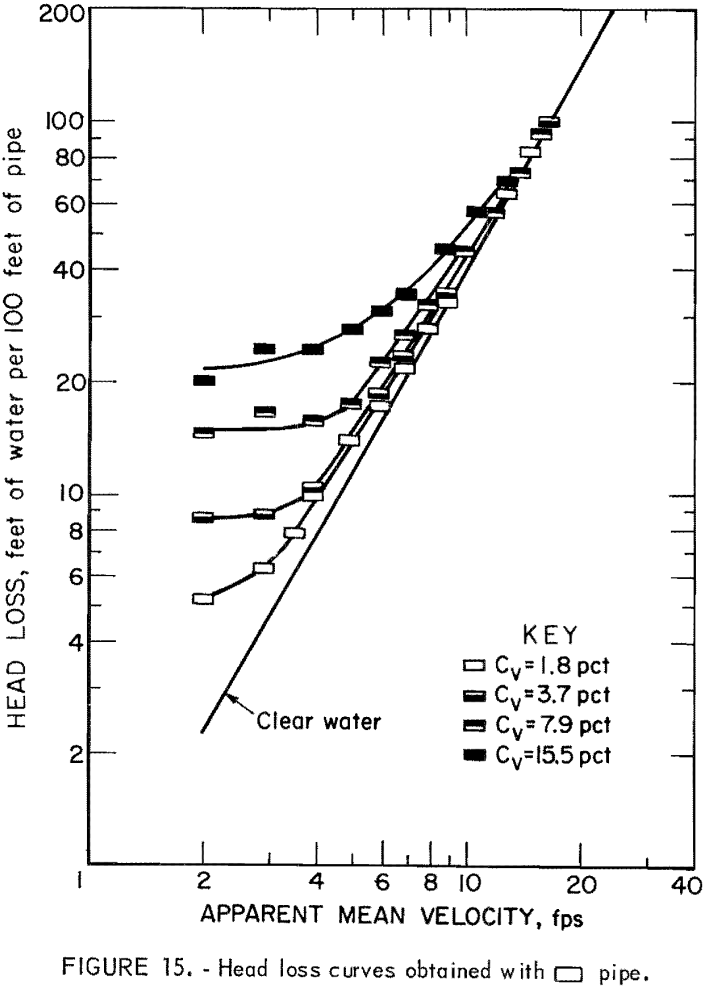
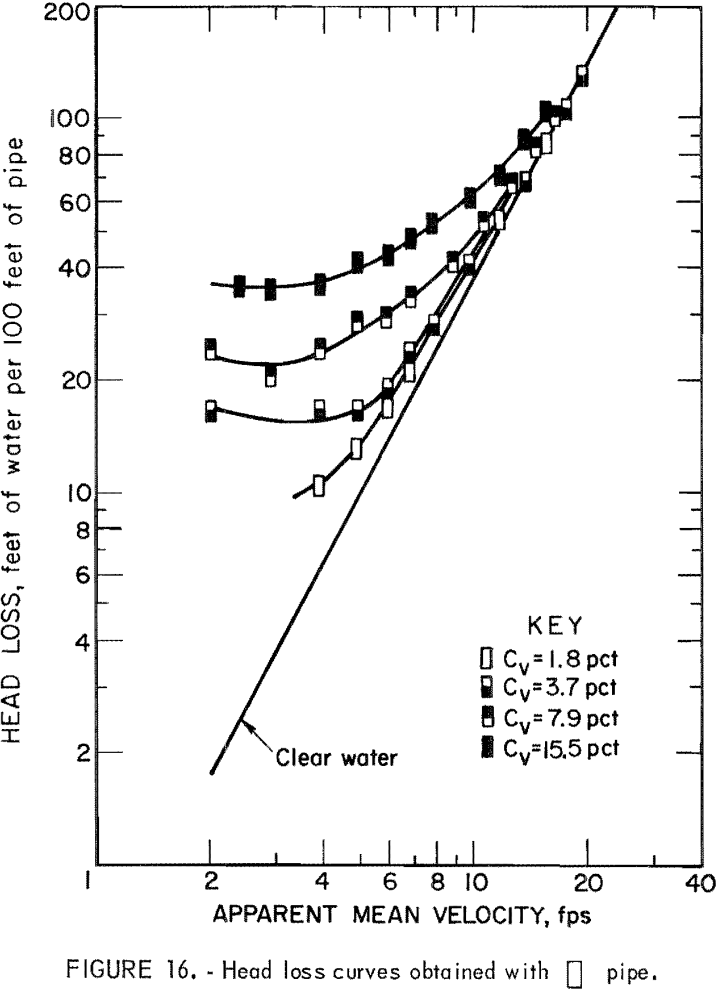
Results of the head loss experiments are plotted for each pipe in figures 11-16. Data points obtained from clear water head loss experiments were omitted for clarity. At high velocities, the friction head loss curves for slurries generally approach the friction head loss line for water. As the velocity decreases, the slurry head loss curves diverge from the clear water head loss line; the degree of divergence is proportional to the solids concentration.
Comparison of Clear Water Head Loss Using Darcy’s Equation
The relationship between clear water head loss and velocity in circular pipe is expressed by the Darcy-Weisbach equation;

By introducing the concept of the hydraulic radius, circular and noncircular sections can be treated in the same way. The hydraulic radius, R, is defined as the cross-sectional area divided by the wetted perimeter. By substituting 4R for D, equation 4 can be applied to noncircular pipe. In general, equation 4 may be expressed for any pipe cross section as
iw = GV²………………………………………………………..(5)
where iw is the clear water head loss per 100 feet of pipe and
G = 100f/8Rg…………………………………………………..(6)
Based on equation 5 and the data obtained from clear water head loss experiments, the values of G for different pipes were obtained by linear regression analysis (table 4).
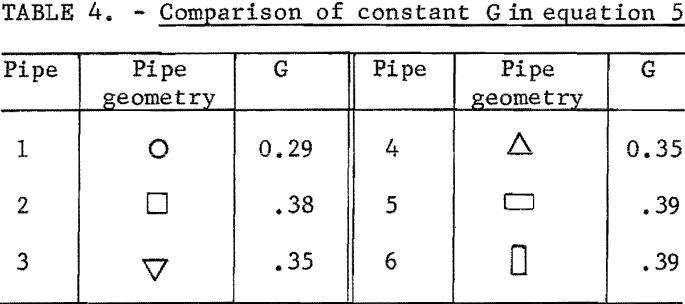

It will be seen from table 4, the circular and the rectangular pipes gave the smallest and the largest values of G, respectively. Since a smaller G in equation 5 means a lower head loss at a given velocity, head loss was lowest in the circular pipe and highest in the rectangular pipe. Pipes having the same cross section but oriented differently (pipes 3-4; pipes 5-6) had the same clear water head loss.
Comparison of Solids Head Loss Using Durand’s Equation
The formula derived by Durand and Condolios was used to study the solids head loss of each pipe. The general form of this equation is

The head losses with and without solids, im, and iw, respectively, are expressed in feet of water per 100-foot pipe. The drag coefficient is represented by Cd for particles having a diameter d and settling velocity Vs in still water and can be obtained by using Newton’s law of turbulent settling,

K and m are empirical constants characterizing the relation between ∅ and ψ.
Head Loss Ratio
To apply Durand’s equation to noncircular pipe, D is replaced by 4R in equation 9 to give

In addition, two other new terms are introduced:

If equation 7 is multiplied by Cv on both sides, Durand’s equation becomes
![]()
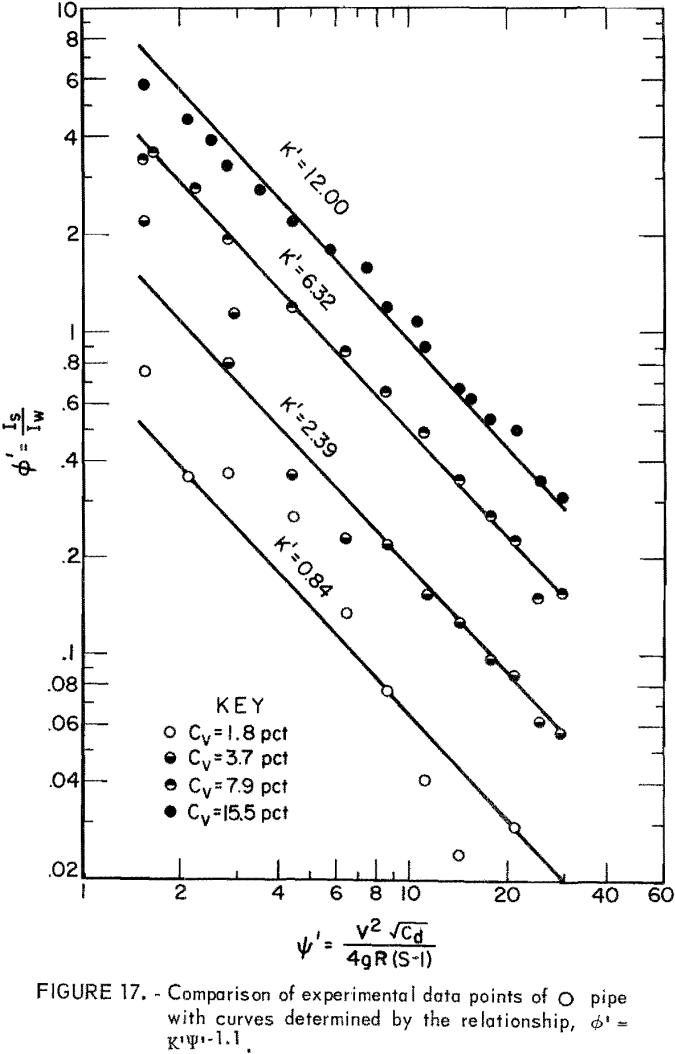
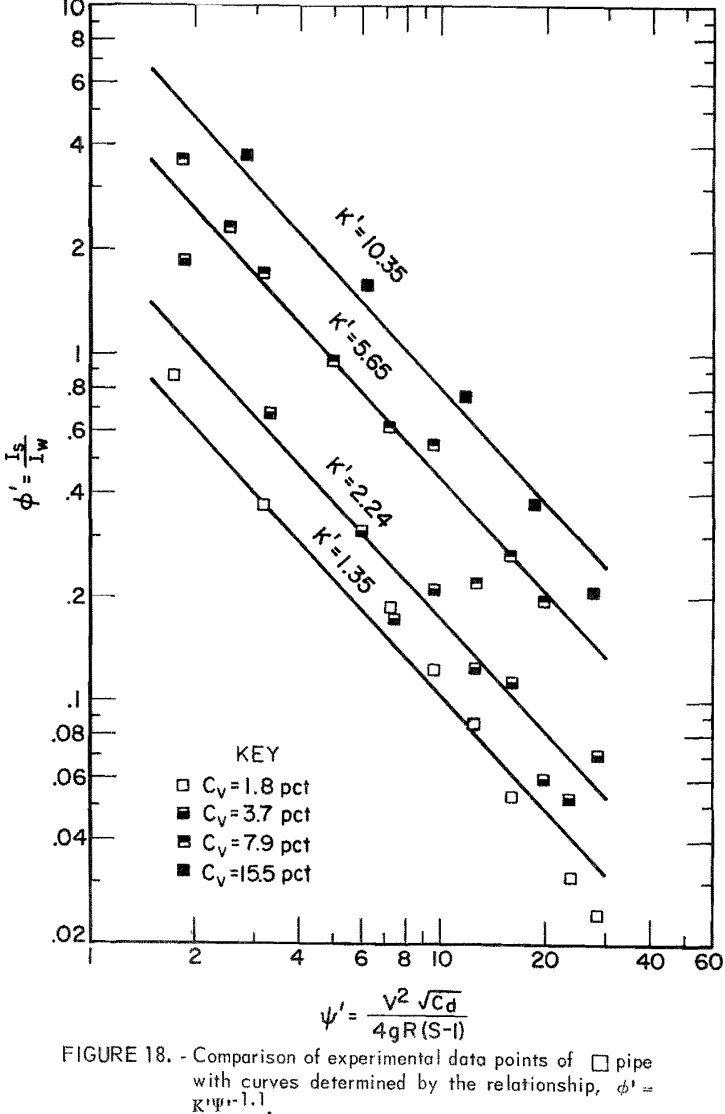
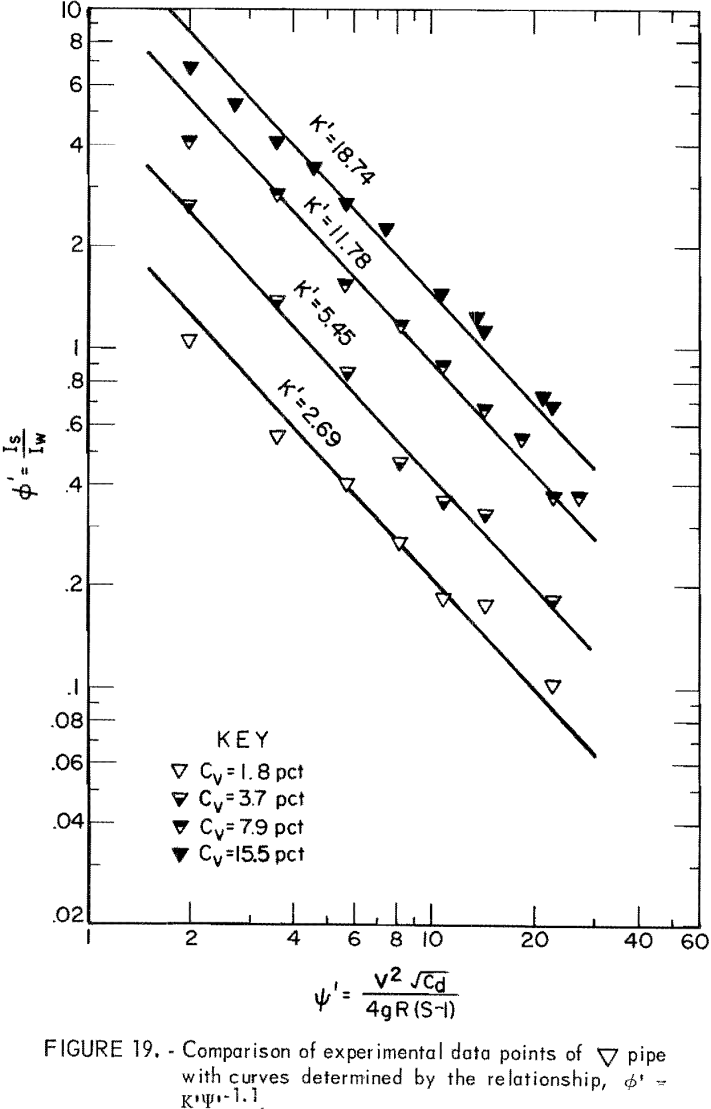
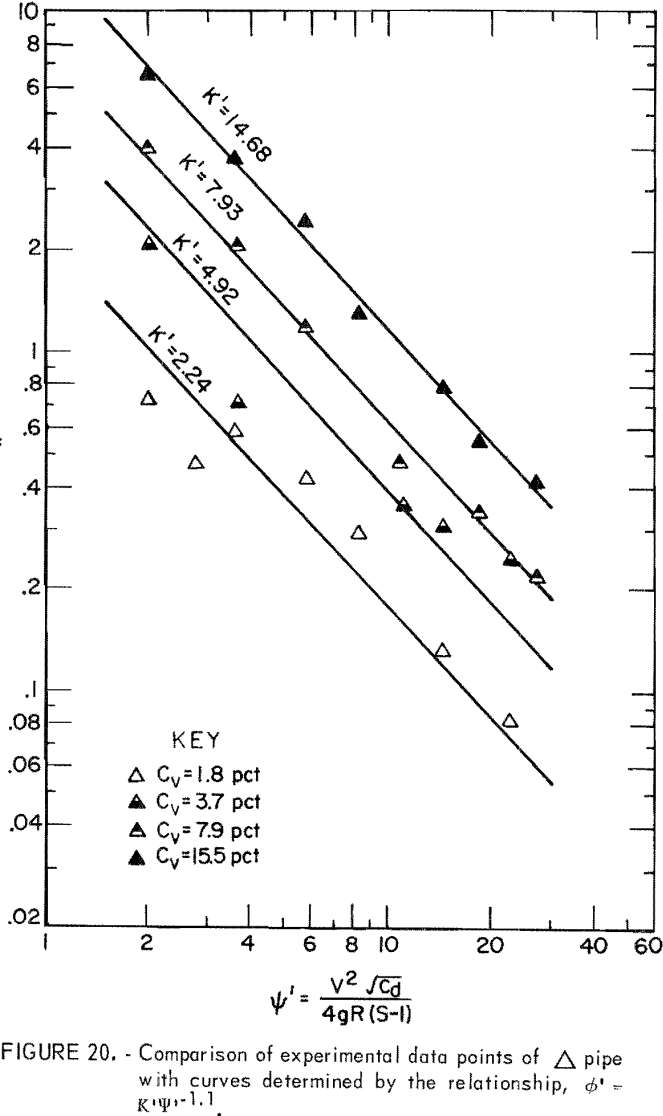
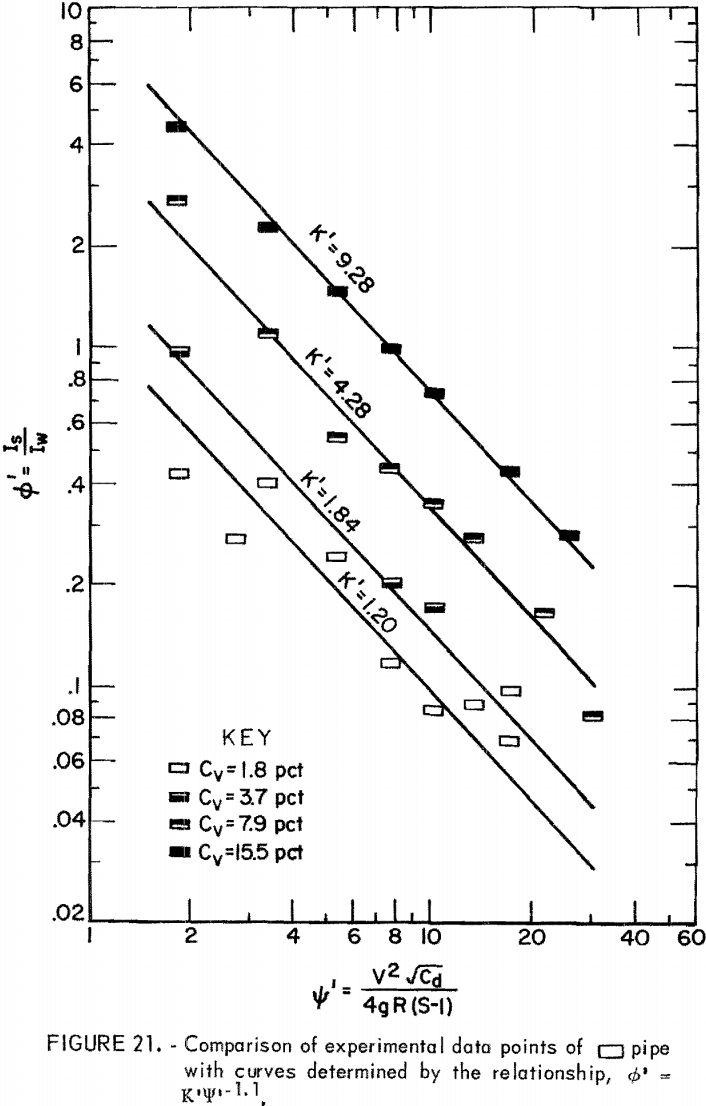
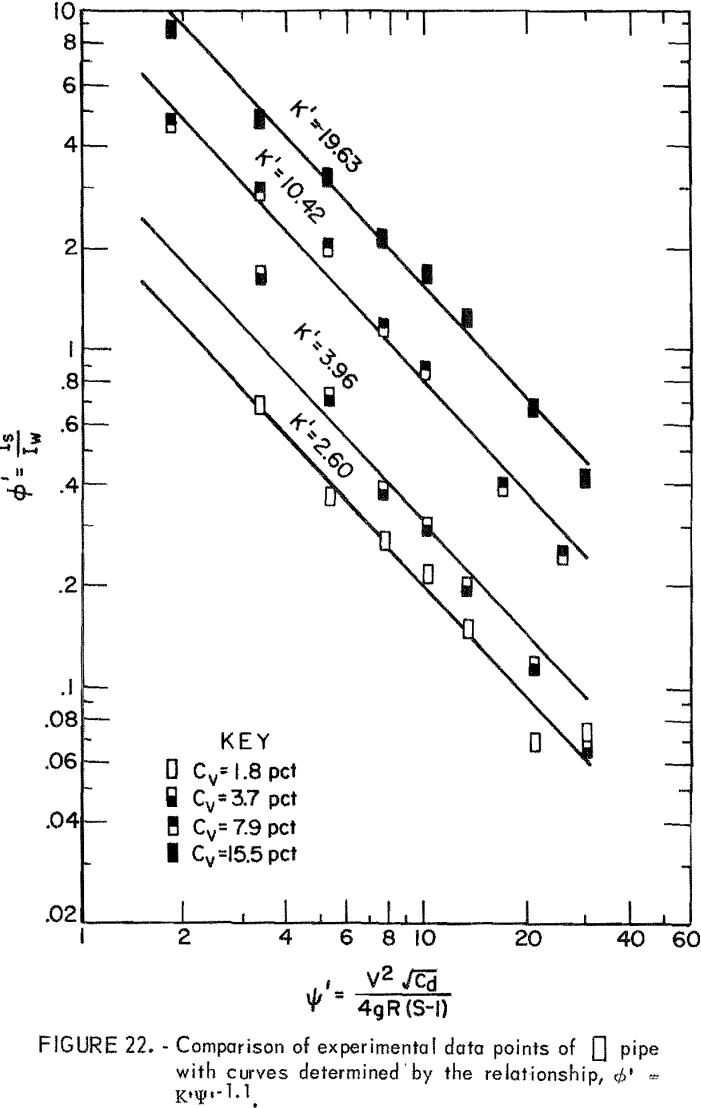
where ∅’, the head loss ratio, represents the ratio of solids head loss to clear water head loss in a given pipe. The empirical constant K’ characterizes the relation between the head loss ratio and ψ’ at a given Cv.
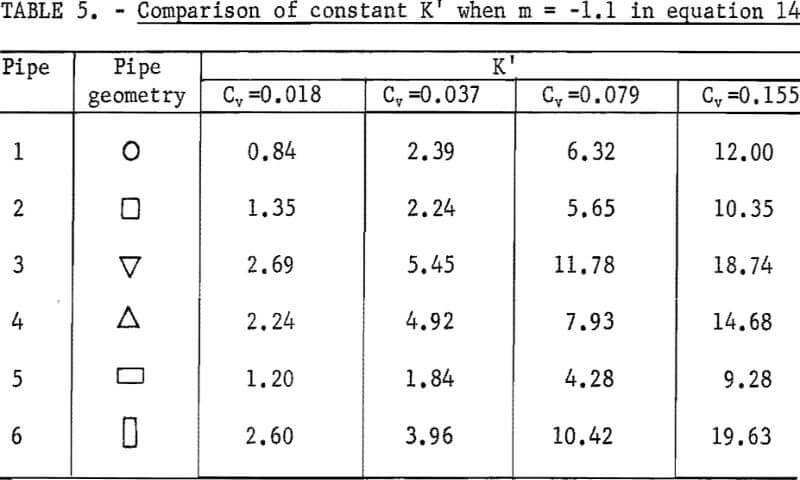
Based on the data derived from the slurry head loss experiments, ∅’ and Ψ’ were evaluated and plotted on log-log paper. Then, equation 14 was used to fit the plotted points for each Cv. Results indicated that equation 14 best represents the data in the range from Ψ’ = 1.5 to Ψ’ = 30 although correlation at the lowest Cv is relatively poor (figs. 17-22). The empirical constant m is found to be -1.1 for all Cv’s and for all pipe shapes, but the K’ value corresponding to an identical Cv varies from pipe to pipe.
For a given solids concentration in different pipe shapes, a decrease in K’ indicates a decrease in head loss ratio; that is, the solids head loss decreases with respect to the clear water head loss. Table 5 shows values of K’ obtained for each pipe at different Cv’s. The circular pipe yields the smallest K’ at the lowest Cv but pipes 2 and 5 yield smaller K’s than does circular pipe at high Cv’s. This suggests that pipes 2 and 5 show a reduction in head loss ratio at the higher Cv’s. This also suggests that, although K’ increases as Cv increases in all pipes, the K’ of circular pipe increases at a higher rate than that of pipes 2 and 5 as Cv increases. Pipes 3, 4, and 6 have larger K’ values than does circular pipe, and therefore, these are not as good.
Solids Head Loss of Circular Pipe and Noncircular Pipe
The solids head loss in noncircular pipe cannot be compared with that of circular pipe because the head loss ratio obtained for each pipe is based on a different clear water line. The following technique is used to eliminate the interference of different clear water lines and to determine the net effect of pipe geometry on solids head loss.
From equation 14,
![]()
Substituting equation 5, equation 15 becomes
![]()
Since K’, m, and G have been obtained, is is a known function of Ψ’ between Ψ’ = 1.5 and Ψ’ = 30. The solids head loss in noncircular and circular pipe is compared as follows:

Further simplication of equation 17 leads to

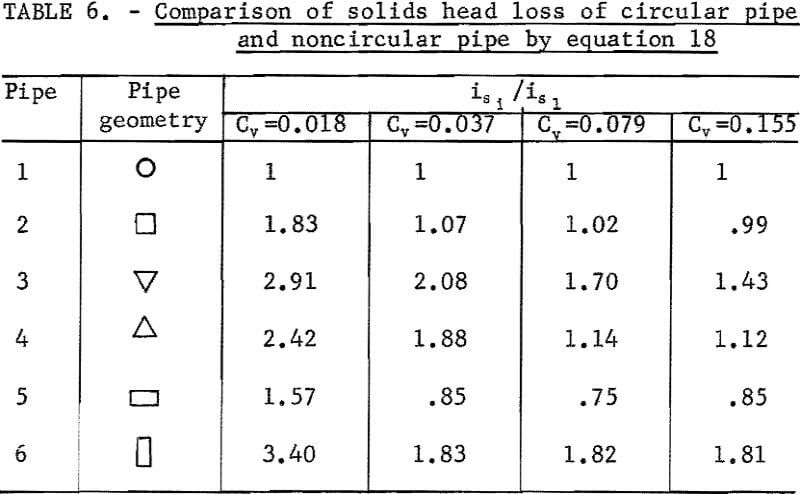
Therefore, the solids head loss ratios of circular and noncircular pipes can be evaluated by constants K’, R, m, and G. Results are shown in table 6.
The ratio

indicated that solids head loss is lower in noncircular pipe than in circular pipe. Thus in table 6, less energy would be consumed by solids head loss when pipe 5 is used at 0.037, 0.079, and 0.155 Cv.
Reduction of Slurry Head Loss
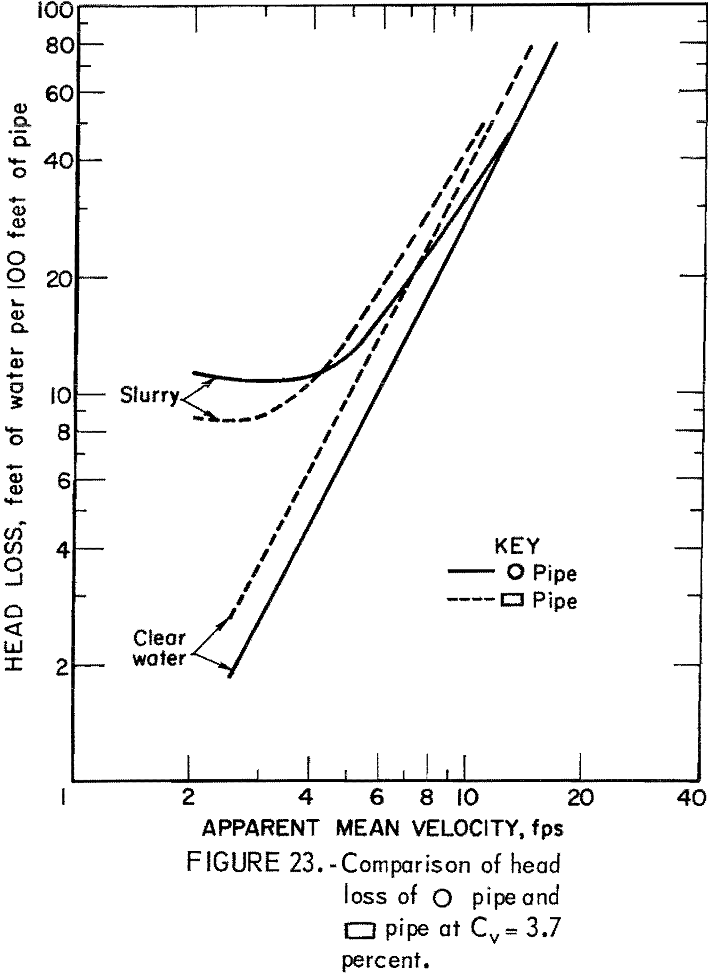
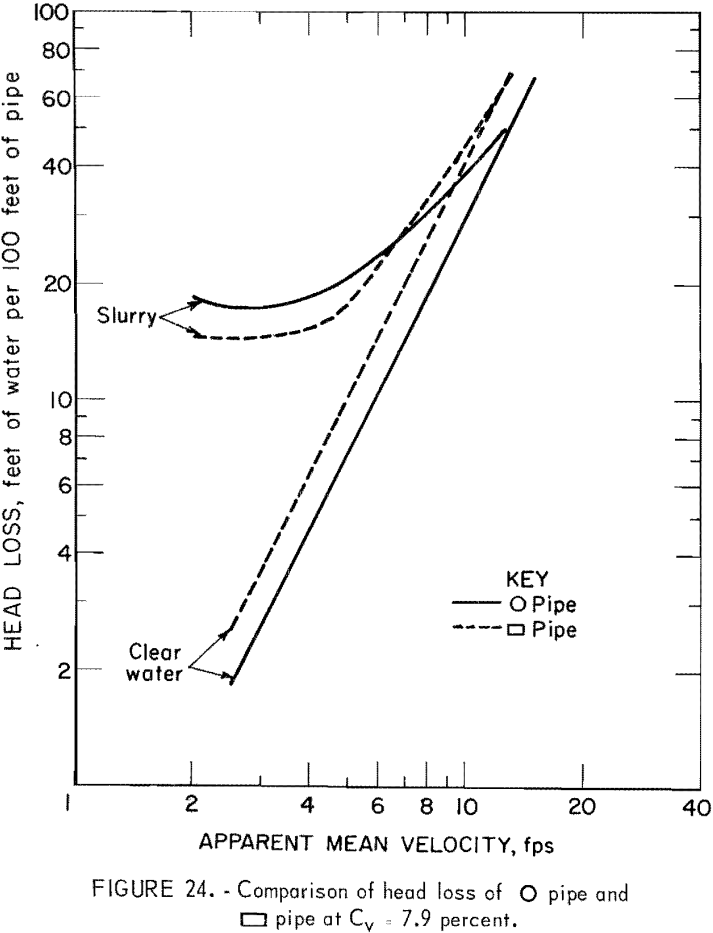
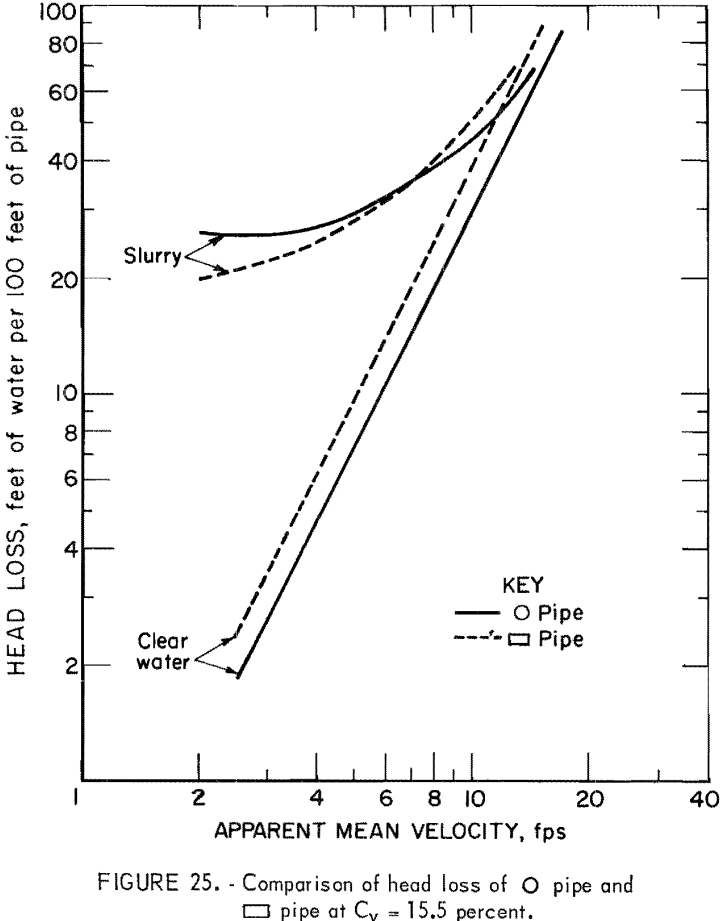
The slurry head loss is the sum of the clear water head loss and the solids head loss. All noncircular pipes have a higher clear water head loss than does circular pipe; therefore, to obtain a lower slurry head loss, a non-circular pipe must have a lower solids head loss than does circular pipe. However, such a lower solids head loss may not be enough to insure a lower slurry head loss. The sufficient condition for noncircular pipe to yield a lower slurry head loss than that of circular pipe is

Analysis of solids head loss shows that only pipe 5 satisfies equation 19; thus, the possibility of im5 < im1 exists. This is illustrated in figures 23-25.
Summary and Conclusions
Solid-liquid flow in noncircular pipes was investigated by measuring both the delivered solids concentration and head loss.
In the delivered solids concentration experiment, the effect of pipe geometry on the minimum carrying velocity above which solids will not lag behind the fluid was investigated. Of the six pipes studied, it was found that at high concentrations the rectangular pipe with the wide side installed horizontally and the triangular pipe with apex turned down yield the lowest and the highest minimum carrying velocities, respectively. At the low concentrations, pipe geometry has no significant effect on minimum carrying velocities.
In the head loss experiment, runs with clear water and slurry were made mainly to investigate the effect of pipe geometry on solids head loss. At the solids concentrations of 3.7, 7.9, and 15.5 volume-percent, the solids head loss of the rectangular pipe with wide side installed horizontally was about 80 percent of that in circular pipe. Further comparison of slurry head loss of this rectangular pipe and circular pipe showed that a 15- to 30-percent reduction in slurry head loss, depending on the apparent mean velocity and solids concentration, might be expected. Solids head losses in other pipes were all higher than in circular pipe. Among the pipes tested, the triangular pipe with apex turned down and the rectangular pipe with the wide side oriented vertically yielded an especially high head loss.
Pipe geometry does have a significant effect on slurry flow, and the base area of the pipe was found to be the most important geometric characteristic for slurry transport. For example, when the gravitational forces are larger than the forces produced because of turbulence, particles settle on the bottom of the conduit and form a sliding bed. If the base area is very wide, as in the case of the rectangular pipe with long axis oriented horizontally, this layer of solids is very thin compared with those formed in the pipes having a more narrow base area. Given the same velocity head, the thin layer can be moved with less energy, which means less energy loss between the fluid and the particles and between the particles themselves. This provides a reasonable explanation for the wide-base rectangular pipe having a low minimum carrying velocity and a low slurry head loss. Although secondary currents in the non-circular pipes may appear to be another reason for the reduced energy loss, the effect of these currents are insignificant compared with the effect of the base area on slurry flow. This argument can be resolved simply by comparing the results obtained for the two different orientations of the rectangular pipe.
Further studies are recommended using rectangular pipes of different width-height ratios or other pipes with different shapes and large base area to study their effects on solid-liquid flow.
