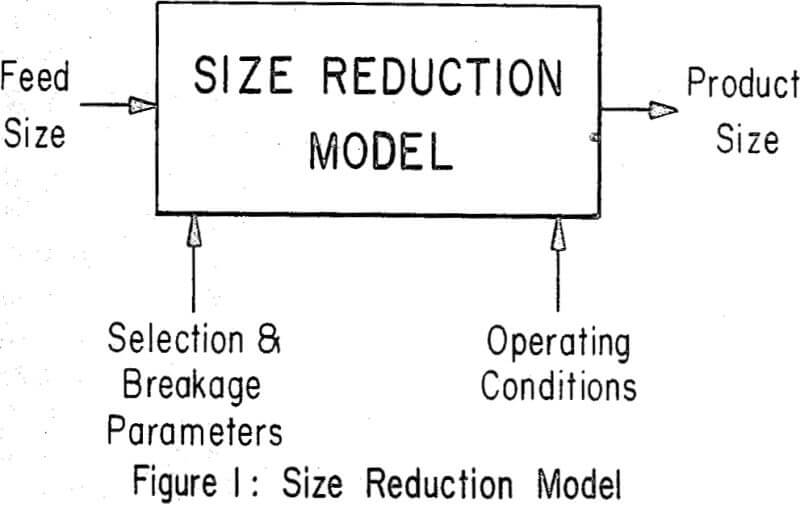
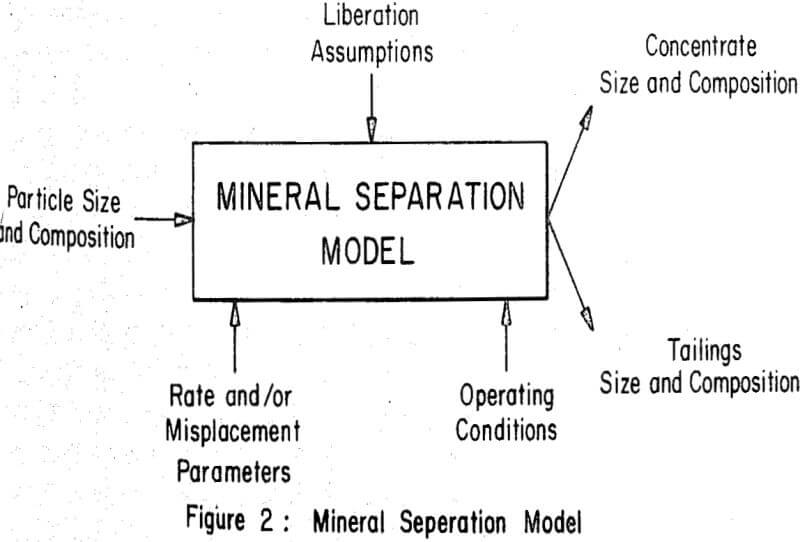
Success has been achieved in developing mathematical models of rod mills, ball mills and recently to a limited extent autogenous grinding mills. There is also considerable activity in the development of mathematical models of various mineral concentration operations, such as flotation, magnetic separation and electrostatic concentration. However, at present there is a technological gap which hinders the integration of both size reduction and mineral concentration models into an overall process simulation model.
Demonstration Case Batch Grinding-Liberation
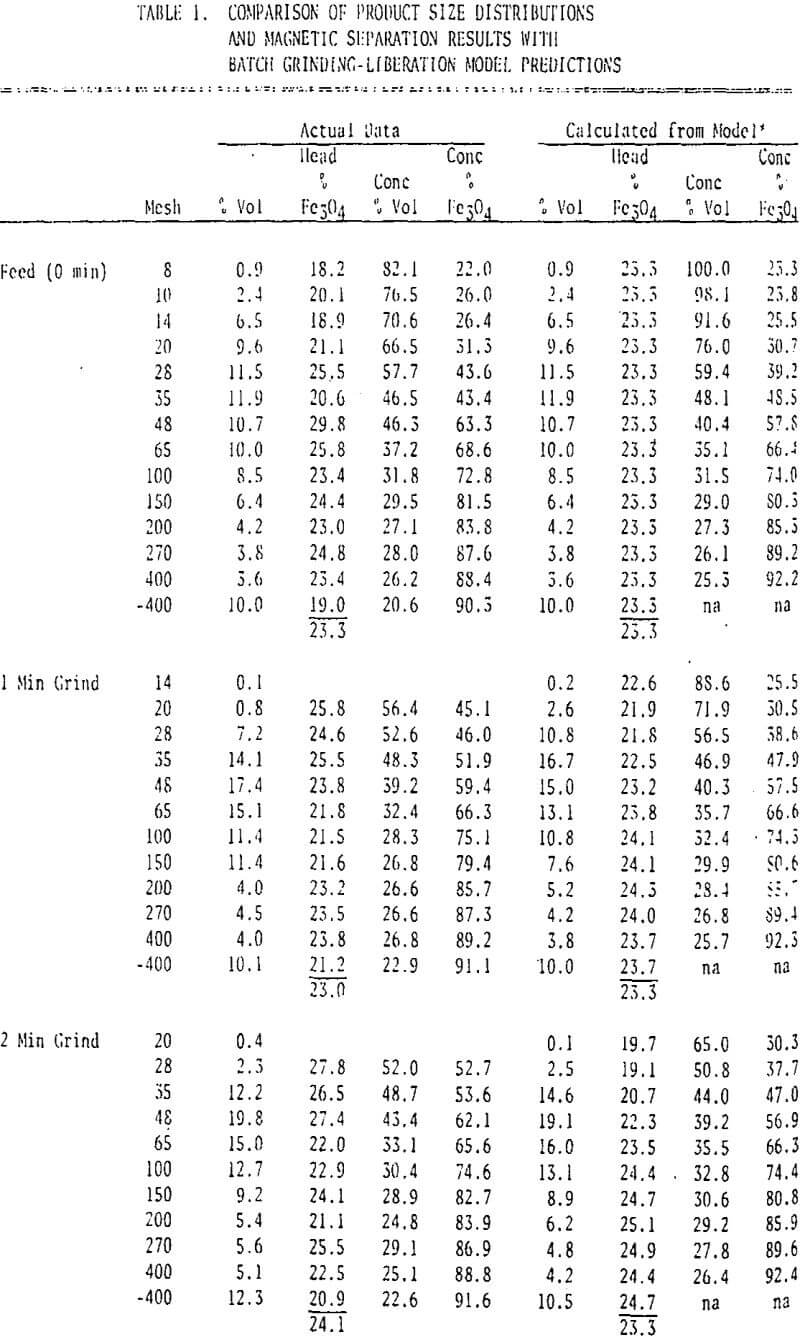
In this presentation the author would like to call for serious thinking in this area by demonstrating one approach to the merging of batch grinding technology to a “first approximation” model describing mineral liberation resulting from size reduction. The data used in this demonstration were generated by batch, wet grinding ore (60% solids) from a low grade magnetite iron formation (25% Fe by weight, 23.3% Fe3O4 by volume) in a laboratory rod mill (10″ x 7″∅), sizing it into fractions and making wet laboratory magnetic separations (Davis tube) on the size fraction to indicate the liberation achieved.
In order to simplify the approach to this modeling problem, the size distribution results (Wi) originally were fit with first order single component batch grinding parameters modified to reflect the supposition that size reduction proceeds only from one size fraction (i-1) to the next smaller size fraction. This permits the use of selection functions (Si) alone to describe a size reduction which would normally require both selection and breakage functions (Bij) to account for the breakage of particles from one size fraction into all smaller size fractions.

In the laboratory magnetic separation of size fractions of ground iron formation it is possible to separate essentially all magnetite containing particles from liberated waste particles. A comparison of laboratory obtained concentrate grades for the various particle size ranges (Bi) and those concentrate grades calculated from the liberation model for the grade of the crude ore (VB) and various ratios of particle size to mineral grain size (Bi/a) permit an estimation of mineral grain size (α).
In describing the size reduction of a binary mineral system which is undergoing liberation, it is necessary to account for the fact that three types of particles are being broken, the two liberated mineral species and the locked specie. When liberated particles break to a finer size fraction, they remain liberated and of the same mineral specie. When locked particles break they produce liberated valuable mineral, liberated waste mineral and some particles which remain locked.
Finite difference forms of these equations were used to model the combined batch grinding-liberation of the crude ore sample, based on the selection functions calculated for the total ore, the crude ore assay, and the effective mineral grain size obtained by comparison with the liberation model. The product size distribution, the quantity of magnetics (liberated valuable mineral and locked valuable mineral particles) and the volumetric grade of these magnetics were calculated by the combined model. An initial simulation was made assuming both the valuable and waste minerals had the same selection function as the total ore.
A comparison of the simulation results with the actual data indicated that some size fractions had considerably less magnetics than predicted. The largest deviations occurred in the coarse size fractions of each grind, suggesting a selective grinding of valuable mineral.
In terms of the combined model, this translates into higher selection functions for magnetite than for waste mineral. It was therefore assumed that this composition effect could be represented by a constant ratio (K) between the selection functions for magnetite and waste, and further that the selection function for locked particles could be calculated on the basis of its volumetric composition (V).
A further simulation using this technique and a selection function ratio of 1.4 to describe selective grinding provided a much better prediction of the fraction magnetics in each size interval resulting from batch grinding as shown in Figure 10. However, it was not possible to simulate any selective grinding which may have taken place in the production of the original crude ore sample, and therefore those deviations remain.


