Table of Contents
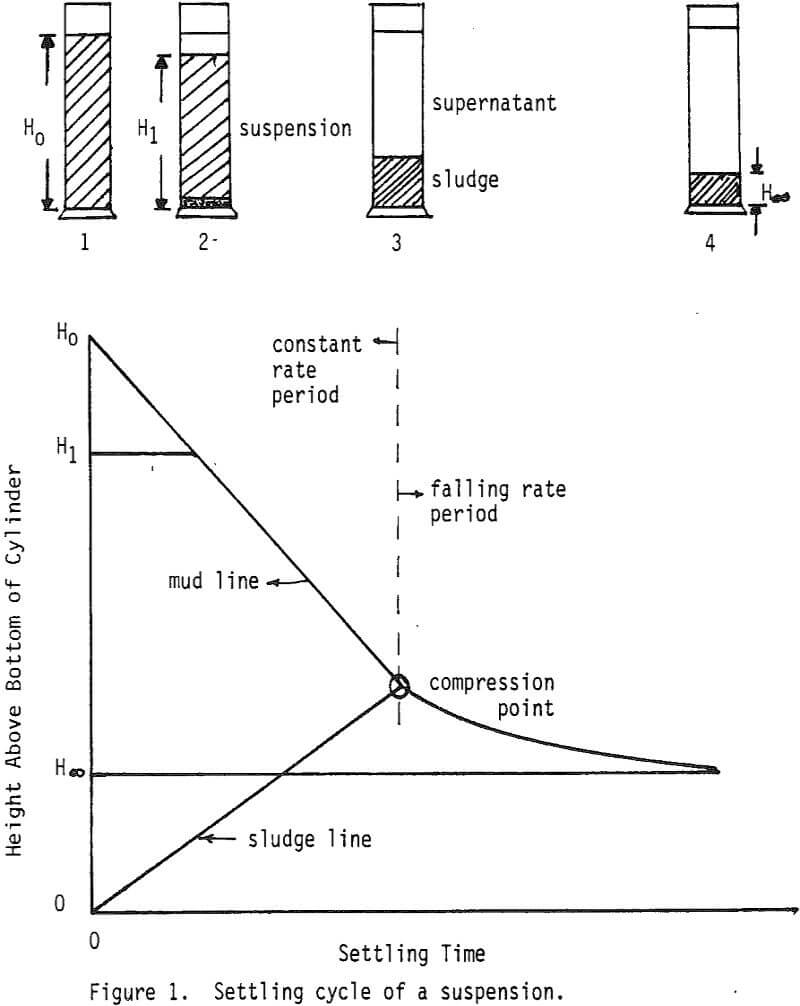
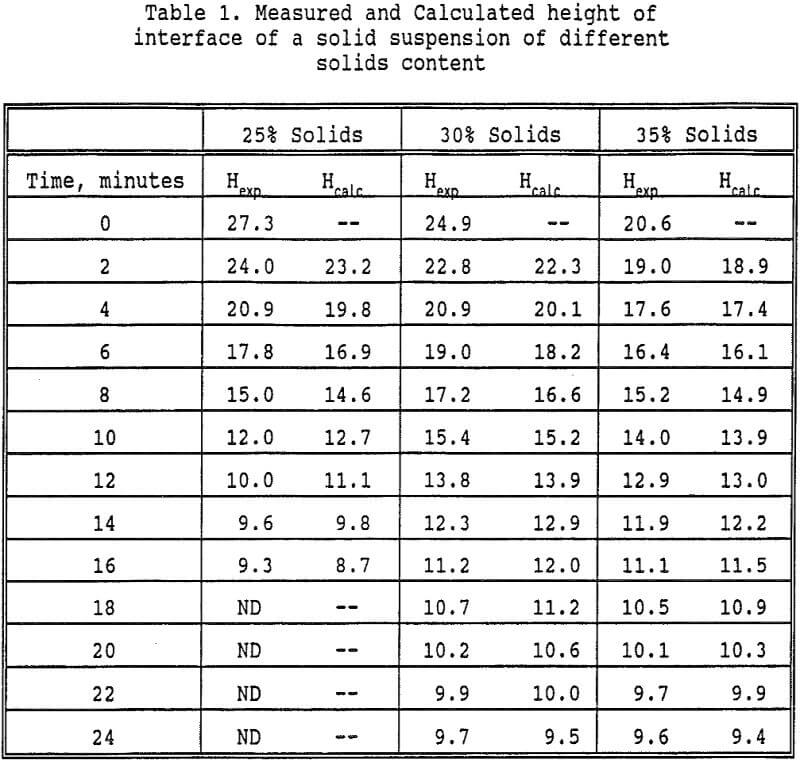
Sedimentation is used to clarify process effluents or to thicken process slurries. The sedimentation cycle of a suspension is presented as a settling curve. This curve is simply a plot of the height of the interface between the settled suspension and clear liquor versus time.
The interface between the supernatant and suspension is termed the mud line. It is also possible to distinguish at the bottom of the cylinder a layer of sludge representing solids which have settled from the suspension. The interface between it and the suspension is called the sludge line. The sludge line moves upward in the cylinder.
Analysis of Settling Curves
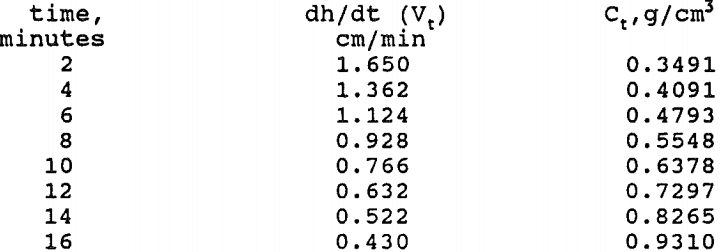
Generally, a useful way of plotting settling data is to determine the settling rate at various points in time along the curve and to plot the settling rate against various parameters such as: time, height, dimensionless height, or solids concentration. The resulting function is termed the settling rate curve.

H0 – initial suspension height
H∞ = ultimate suspension height
Therefore, if the ratio Ht/H0 is plotted on log scale against t on linear scale, a straight line should result if the proposed settling mechanism is obeyed. Most settling curves give straight lines after the compression point, indicating that the settling rate during the constant rate period is not dependent upon the suspension height.
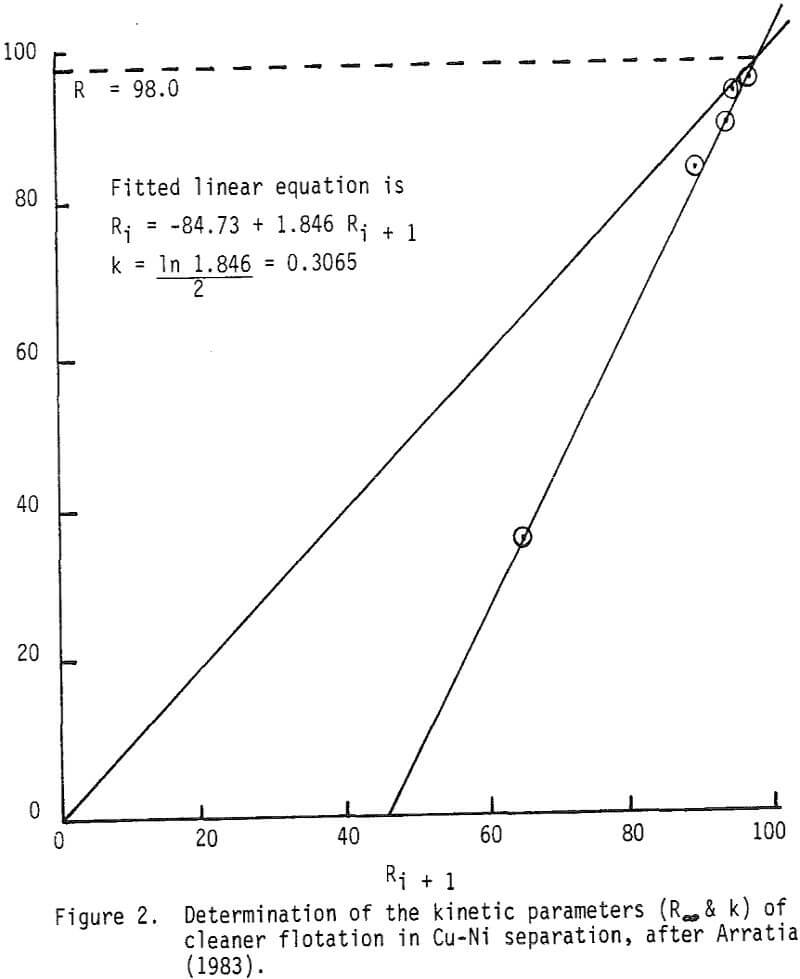
However, using a pocket calculator equipped with statistical analysis capabilities, or a computer, the method can be used without plotting as follows:
(a) Calculate Ri and Ri+1 as described above
(b) Regress Ri+1 vs Ri (linear regression)
(c) Obtain a straight line equation as:
Ri = a + b Ri+1
(d) Set Ri = Ri+1 = R∞
(e) Calculate k = lnb/Δt

Regression Output:
Constant……………………………………………………………-18.3549
Std Err of Y Est………………………………………………….3.260961
R Squared…………………………………………………………0.978483
No. of Observations………………………………………………………7
Degrees of Freedom……………………………………………………..5
X Coefficient(s)………………………………………………….1.211154
Std Err of Coef……………………………………………………0.080319
Thickener Area Calculations
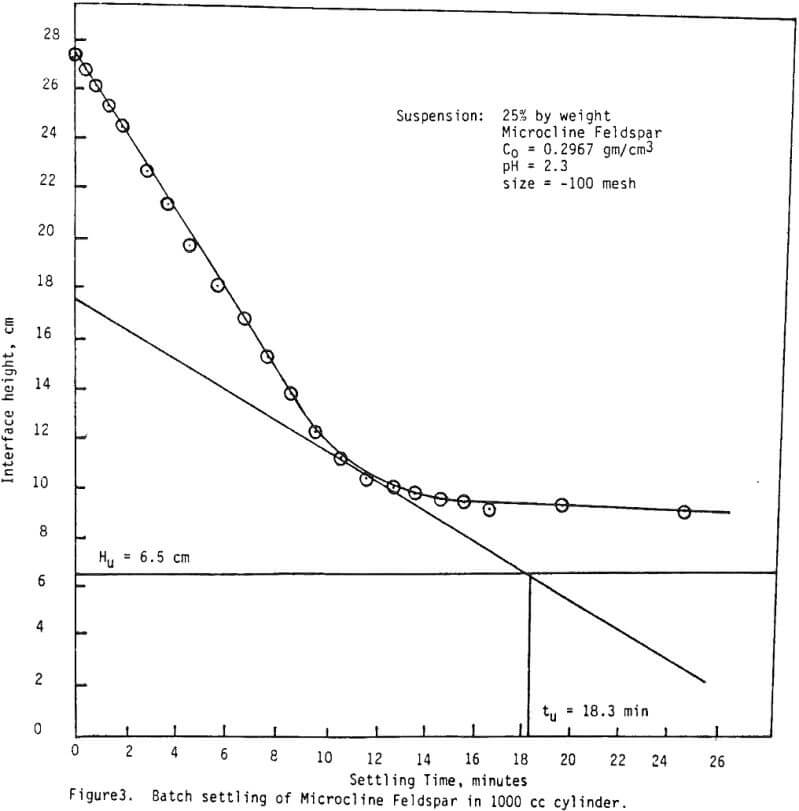
A tangent is then drawn to the curve at the compression point, together with a horizontal line representing the underflow concentration desired. For 70% solids in the underflow, Cu = 1.2517 gm cm³, and utilizing the equation
HoCo – Hu-Cu
where:
H0 = initial pulp height in cylinder (cm) – 27.3 cm
C0 = initial pulp concentration (g/cm³) = 0.2967 g/cm³
Hu = mudline height (cm) corresponding to underflow concentration Cu
Cu = underflow concentration of 70% solids by weight = 1.2517 g/cm³
Thus, Hu = 6.47 cm.
From the graph tu = 18.3 min = 0.0127 days
The thickener area required is then calculated from:
A = T /H0C0
A = thickener unit area (m²/day/mt solids)
tu = underflow time (days)
H0 = initial pulp height (meters)
C0 = initial pulp concentration (mt/m³)
