Table of Contents
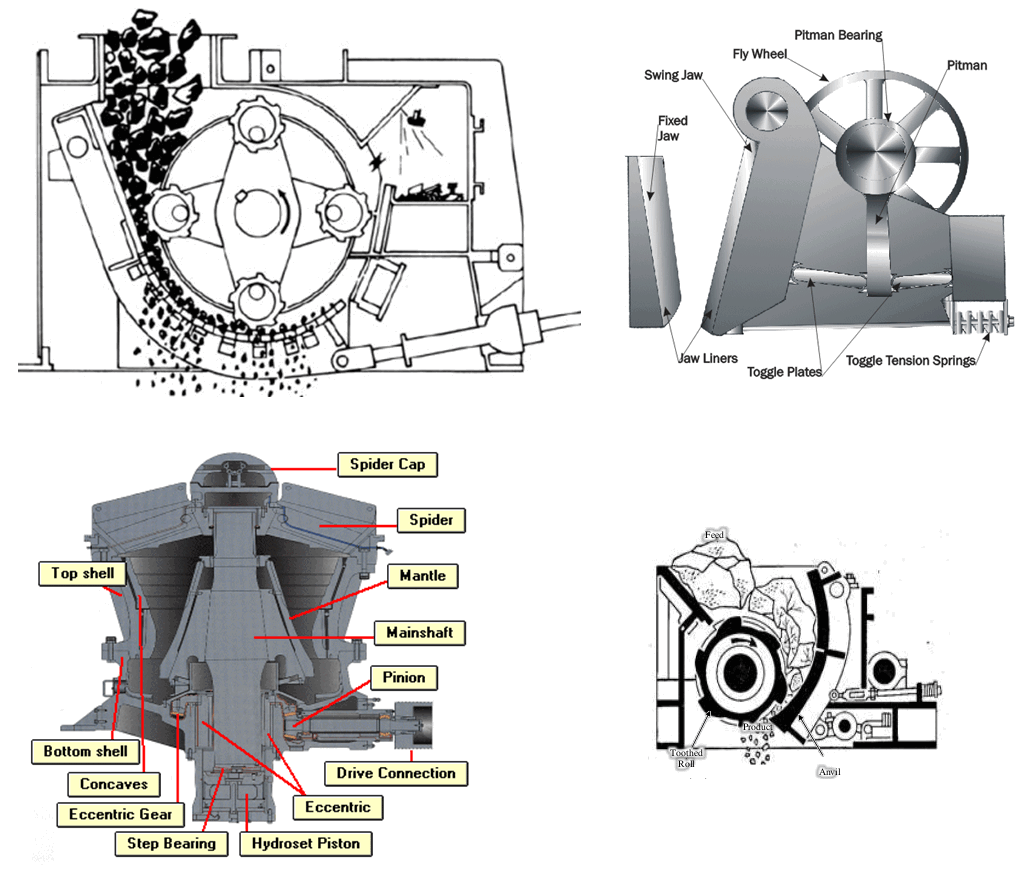
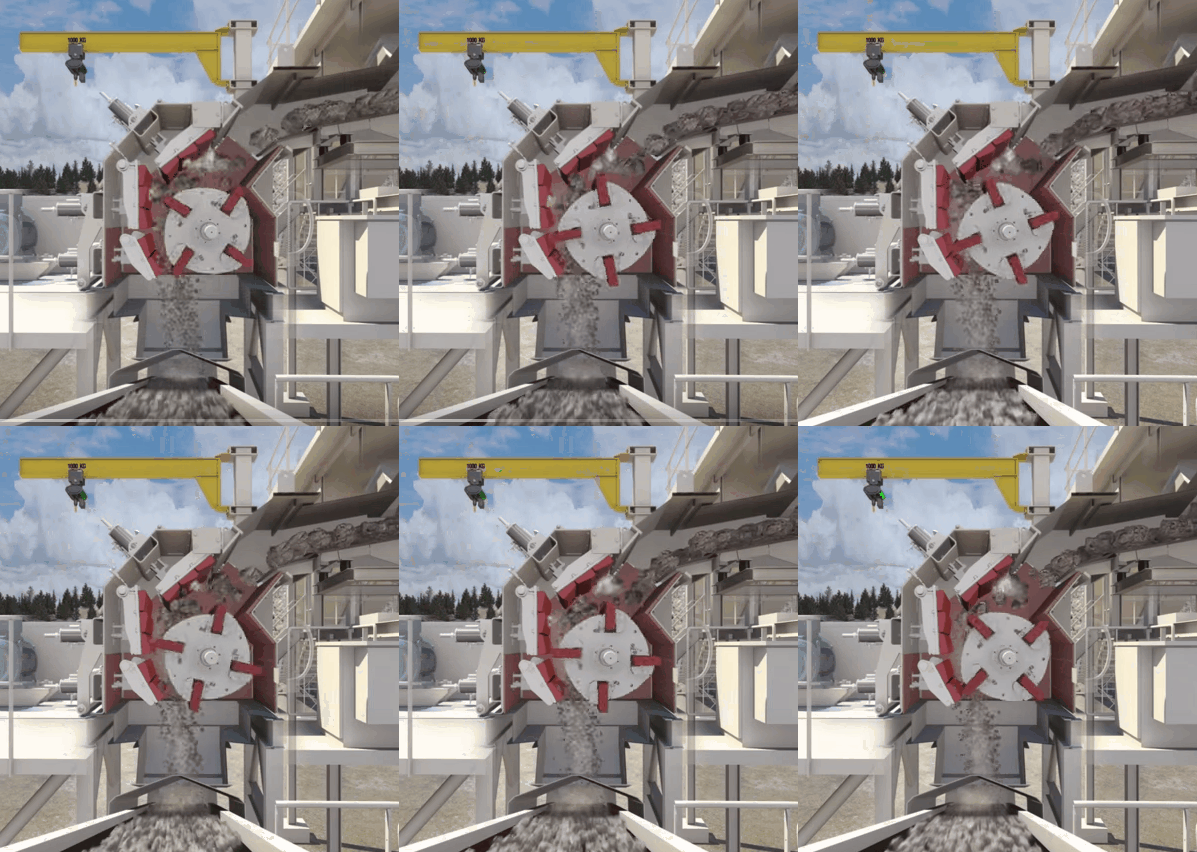
Starting from the base working principle that compression is the forcing of two surfaces towards one another to crush the material caught between them. Impact crushing can be of two variations: gravity and dynamic. An example of gravity impact would be dropping a rock onto a steel plate (similar to what goes on into an Autogenous Mill). Dynamic impact could be described as material dropping into a rapidly turning rotor where it receives a smashing blow from a hammer or impeller. Attrition crushing is the reduction of materials by rubbing; primarily a grinding method. Shear crushing is accomplished by breaking along or across lines of cleavage. It is possible, when required, for a crusher to use a combination of two or three of these principles.
The selection or sizing of a crusher is much helped by measuring the rock’s hardness during engineering.
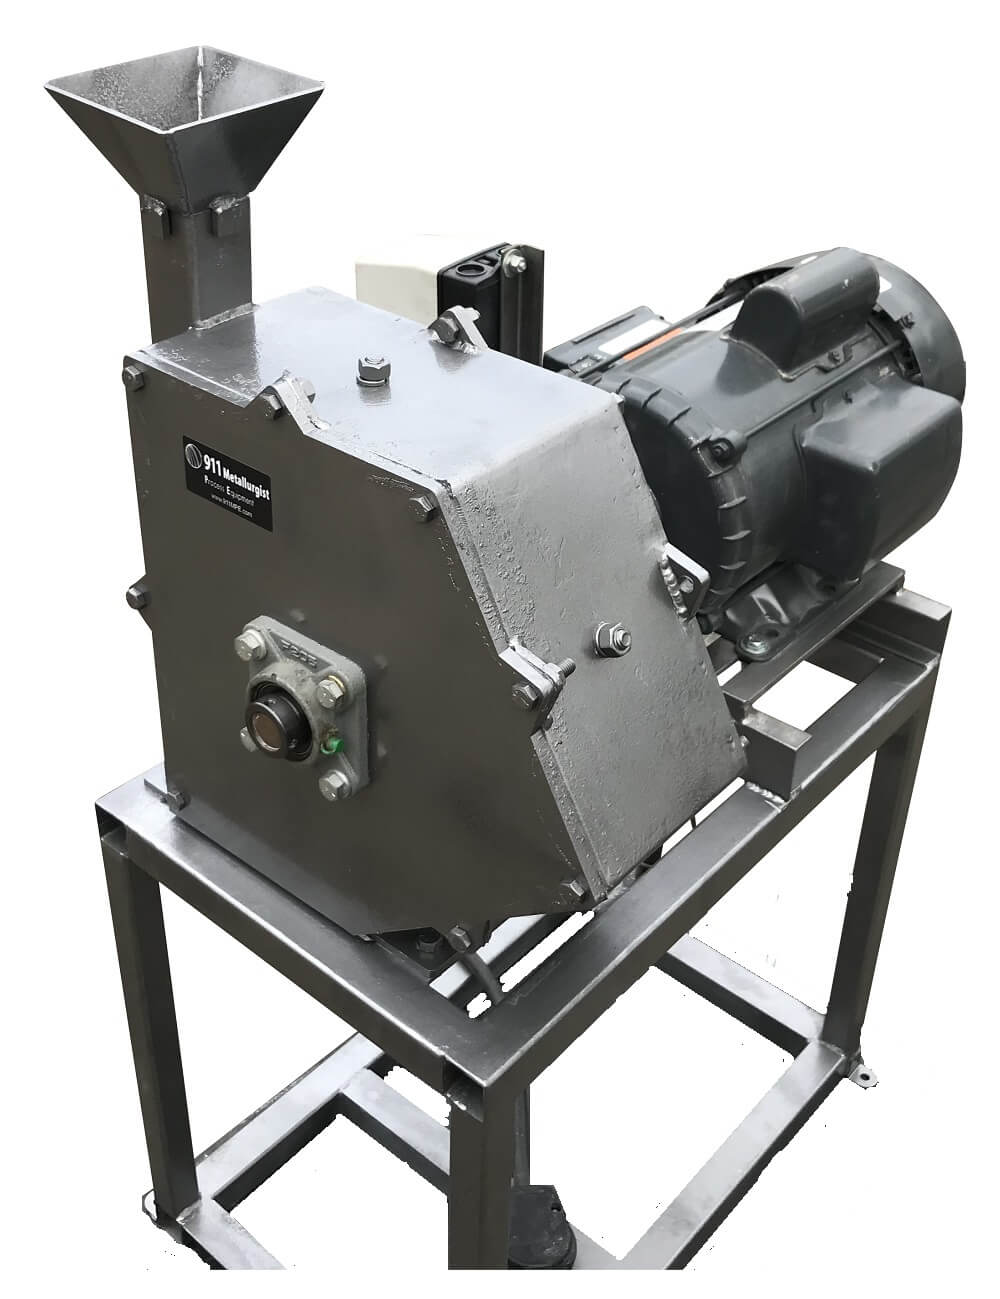
https://www.911metallurgist.com/impact-crusher
 |
Rock Particle Breakage in Impact Crushing
Rapidly increasing operating costs for minerals beneficiating plants continue to be the biggest single problem in maximizing profitability from these operations. The average world inflation rate has been increasing over the last decade and shows little sign of easing. The threat of continued increases in the price of fuel oil will eventually increase the cost of electrical power, in direct proportion for most users. This will undoubtedly cause closure of some lower grade ore bodies unless energy utilization efficiencies, particularly in comminution, can be improved.
Most of the recent literature concerning comminution performance improvement has been directed at grinding mill performance. It can be expected that more refined control systems will improve the overall milling energy efficiency, which is normally the largest single cost component of production. However, published gains by such methods to date appear to be limited to something less than 10%.
The second largest cost for comminution processes is normally that for wear metal consumed in grinding operations.
Allis-Chalmers has continuing -research programs into all forms of comminution processes involving crushing and grinding. Improved crushing technology shows the way to reducing both energy and wear metal consumption mainly by producing finer feed which will improve downstream grinding mill performance.
Because there has been less emphasis on crushing technology than milling, this paper will also discuss objectively the comparisons of energy and wear metal for the two processes.
A new testing procedure for studying crushing phenomena, presently being perfected by Allis-Chalmers, is described for the first time. These bench scale laboratory tests will give more accurate prediction of both – energy requirements and size distribution produced in commercial crushing processes. As a direct result, this machine will allow more accurate comparisons to be made in capital and operating cost expenditures for various combinations of crushing and milling processes.
These new testing procedures can be run on small samples including pieces of drill core material. They could be part of testing and feasibility studies for most new concentrators. The same methods can be used to determine likely yield of various sized crushed products and, therefore, benefit crushed stone producers.
The theoretical and practical phenomena concerning comminution processes have received considerable attention in the literature and are not discussed here in any detail. Instead, the breakage studies in this paper are based on an empirical treatment of the fundamental relationships between energy and the size distributions of processed particles that have been observed both in the laboratory and in large-scale, commercial cone-crushing operations.
Because of the bewildering number of variables encountered when studying comminution processes, most investigators have preferred to assume that the size distribution generated in milling and crushing processes bears some relatively fixed relationship such as those described by Gates-Gaudin-Schuhmann1 or Rosin-Rammler.
Fred Bond, in his “Third Theory of Comminution,” used the former, essentially assuming that size versus cumulative percent passing that size was represented by a straight line of assumed slope 0.5 below the 80% passing size. Based on this assumption, Bond derived his well-known relationship:
W = 10 Wi/√P80 – 10 Wi/√F80…………………………………………………………………..(1)
where W = work in KWH/short ton
Wi = Work Index
F80 = 80 percent passing size of the feed (micrometers)
P80 = 80 percent passing size of the product (micrometers)
The Work Index for rod and ball mills can be determined from laboratory tests and, as demonstrated by Rowland, the relationship gives us a reasonably accurate tool for the design of rotary grinding mill circuits.
Bond’s methods have been less successful in predicting fine crushing performance, however, primarily because the typical crusher feed and product distributions do not meet the assumed conditions necessary for the satisfactory application of his equation (see Fig. (1)).
It is most evident that the curved lines appearing on Fig. (1) do not represent a Gates-Gaudin-Schuhmann size distribution. It is therefore not surprising that Bond’s procedures do not work well in this situation. The Rosin- Rammler distribution has also been found inadequate to generally describe crusher products.
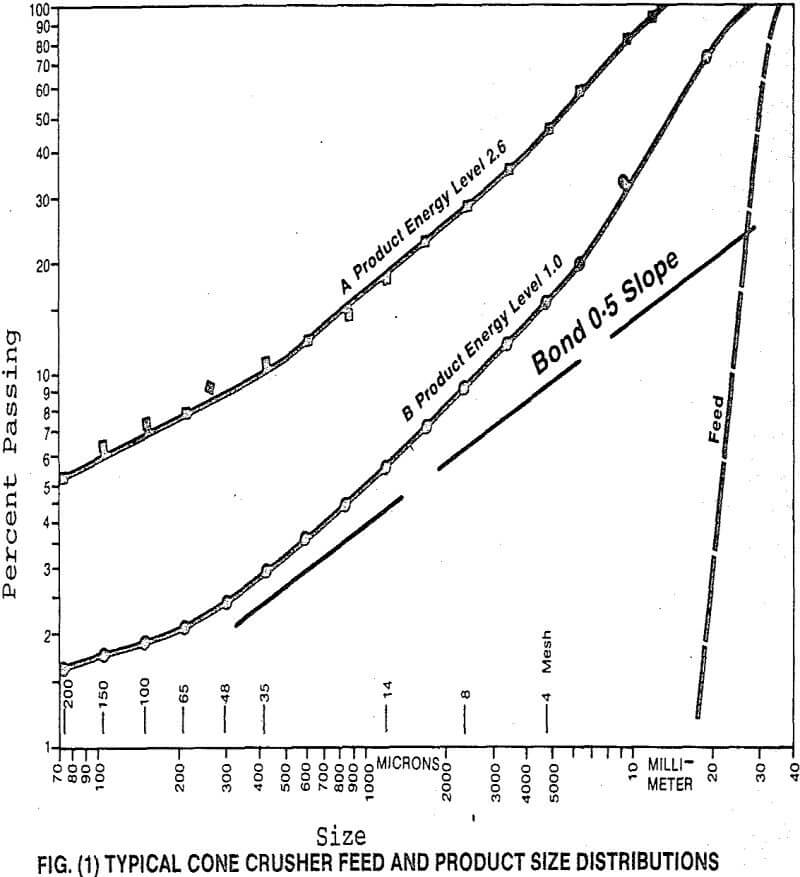
Work during the early 60’s led to the concept of comminution as a repetitive process, with each step consisting of two basic operations — the selection of a particle for breakage and the subsequent breakage of this particle by the machine. In this approach, the process under investigation is modelled by combining the particle selection/breakage event with information on material flow in and out of the comminution device.
Most workers who have used this approach have considered size reduction to be the result of the mechanical operation of the comminution device. This mechanical operation consumes the energy, and size reduction is merely a result of this energy consumption. This viewpoint is reasonably valid for tumbling mills where energy input tends to be constant and the proportion of the energy that is usefully consumed in particle breakage is low (<10%). It does not appear to be valid in compression crushers, however, since breakage energy is a significant proportion (>50%) of the total energy input to the crusher and markedly different power rates (energy input per unit of crusher feed) can be obtained by varying ore feedrates and/or crusher parameters such as closed side setting. It will therefore be necessary to include energy information in any model of the crushing process before it will be possible to accurately predict crusher performance. The inclusion of this energy-size information will significantly increase the complexity of these models.
The single-particle breakage event has been the subject of several studies. Most of these have utilized only sufficient energy to break the particle and do not simulate commercial crushing operations where energy levels are such that catastrophic repetitive breakage usually takes place. This approach to the study of comminution processes does yield valuable information, however, and it is unfortunate that it has not received greater attention.
Test Procedures for the Characterization of Crusher Performance
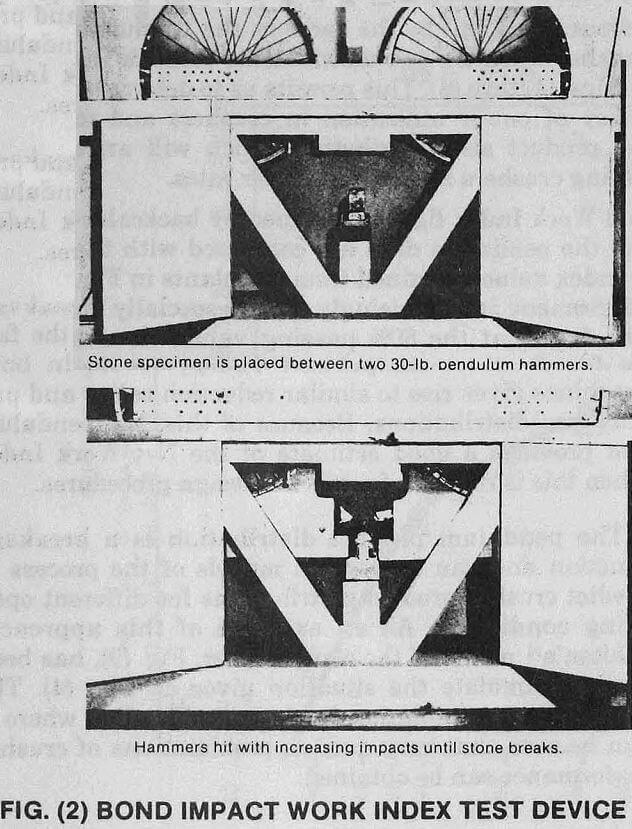
The Bond Impact Work Index method has been an industry standard for the determination of crusher power requirements but was originally developed to ensure, that sufficient power was connected to primary gyratory crushers. In this method, pieces of rock are fractured by trial and error in the test device shown in Fig. (2), until sufficient impact energy has been applied to break the rock.
Normally, the rock breaks in halves, and in most tests only two and seldom more than three large pieces are observed after fracture. No size distribution information is used in calculating the Bond Impact Work Index from the formula:
WI = 2 59 Average Impact in ft-lbs/inch/Specific Gravity…………………………………………(2)
This mode of breakage is similar to that occurring in a primary gyratory crusher where power rates (energy input per tonne of feed) are low (approximately 0.1
KWH/tonne). The procedure works quite well for this type of crusher but tends to understate power requirements in fine crushers where power rates are typically much higher (upwards from 0.25 KWH/tonne).
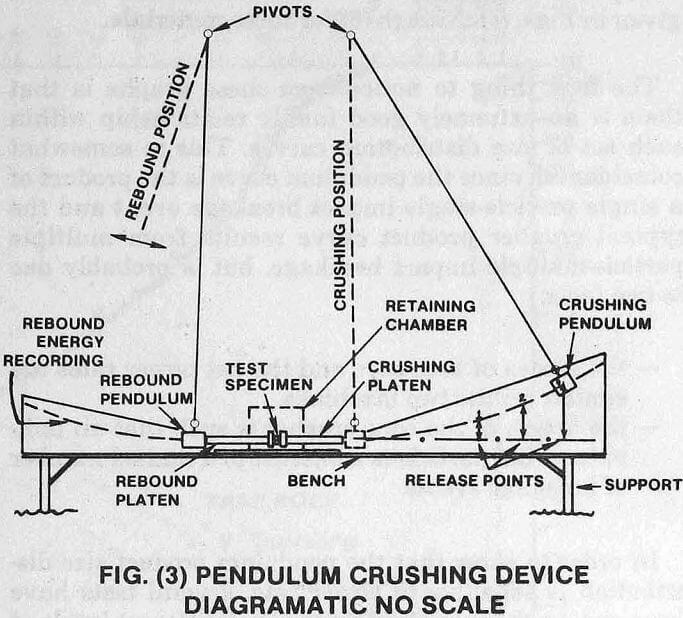
Because of this, a research program was instituted by Allis-Chalmers Comminution Task Force Committee to break rock in a manner more analogous to that observed within commercial fine crushers. A pendulum type test device similar in most respects to that developed by the United States Bureau of Mines and shown diagrammatically in Fig. (3), was built and has been used in an extensive test program to determine whether it would be possible to predict cone crusher performance.
The rock samples selected for crushing in this device are usually minus 38mm (1-½”), plus 19mm (¾”) in size. The sample rock is weighed and then placed between the platens. The end of the rebound platen is placed in contact with the rebound pendulum and the crushing pendulum is raised to a predetermined vertical height which depends on the size of the sample. The crushing pendulum is then released — after striking the crushing platen and breaking the rock, the remaining energy is transferred via the rebound platen to the rebound pendulum. The horizontal distance that the rebound pendulum travels is recorded by displacement of a marker and is subsequently converted to a vertical height.
The energy used in crushing the sample can be approximated from an energy balance of the system:
Ec = E1-KE-E2-EL(Kg—mtrs)…………………………………………………….(3)
where Ec = crushing energy
E1 = crushing pendulum potential energy (before release)
KE = kinetic energy of the two platens
E2 = rebound pendulum maximum potential energy (after crushing)
EL = system energy loss (sound, heat, vibration)
The system energy loss, EL, is determined by plotting EL as a function of the initial height of the crushing pendulum with no rock present. The major portion of this loss is by vibration. It is felt that the difference between system energy losses with and without rock present in the system is minimal as long as enough initial energy is supplied to result in a small elevation of the rebound pendulum.
The fragments from several rock samples broken under identical conditions were combined for each of the size analyses reported in this paper. Bond Work Indices were also backcalculated from the data using the standard formula, i.e.

where F80 is defined as the length of the side of the cube of the same weight as the average particle.
Confirmation of the ability of the procedure to provide information suitable for the prediction of crusher performance was obtained by taking feed samples from 31 commercial operations treating a wide range of rocks and ores. At the time of taking a feed sample for laboratory testing in the pendulum device, relevant performance data such as power, feed rate and size distributions for feed and product were taken on the operating crusher. Several thousand rocks have been broken during tests with the device over the past 3 years.
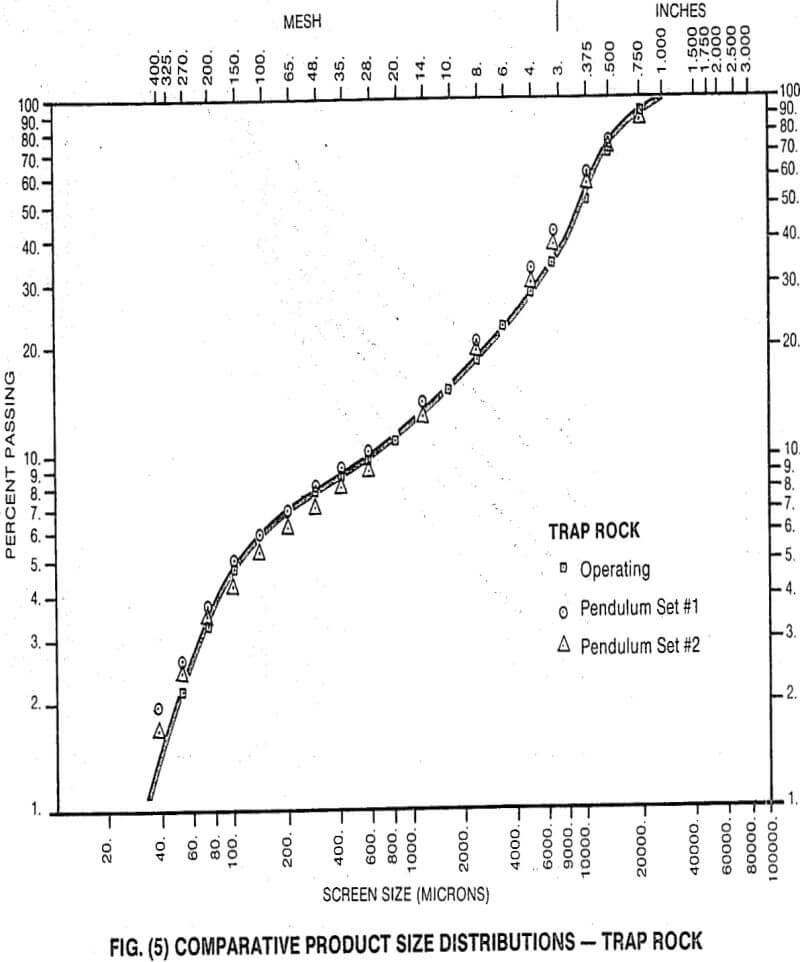
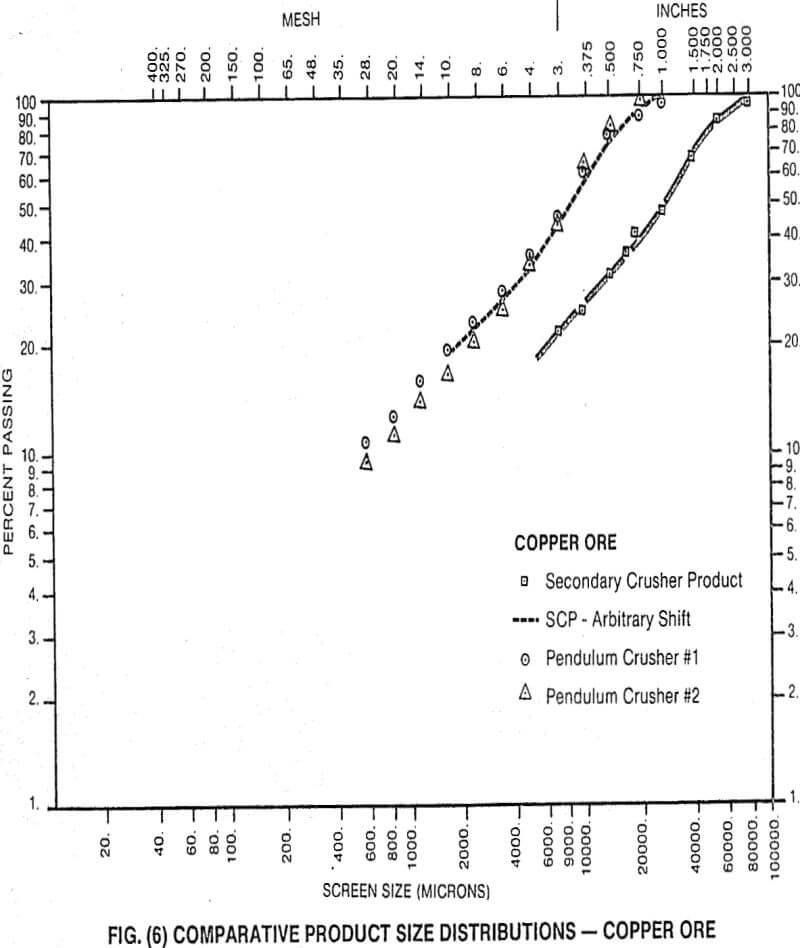
Typical, comparative product size distributions are given in Figs. (4) through (6) for three materials.
The first thing to notice from these graphs is that there is an extremely good family relationship within each set of size distribution curves. This is somewhat coincidental, since the pendulum curve is the product of a single particle-single impact breakage event and the typical crusher product curve results from multiple particle-multiple impact breakage, but is probably due to two facts:
- the modes of breakage and the net power rates are similar for the two machines
- the action of the cone crusher is such that an individual feed particle is subjected to a limited number of breakage events
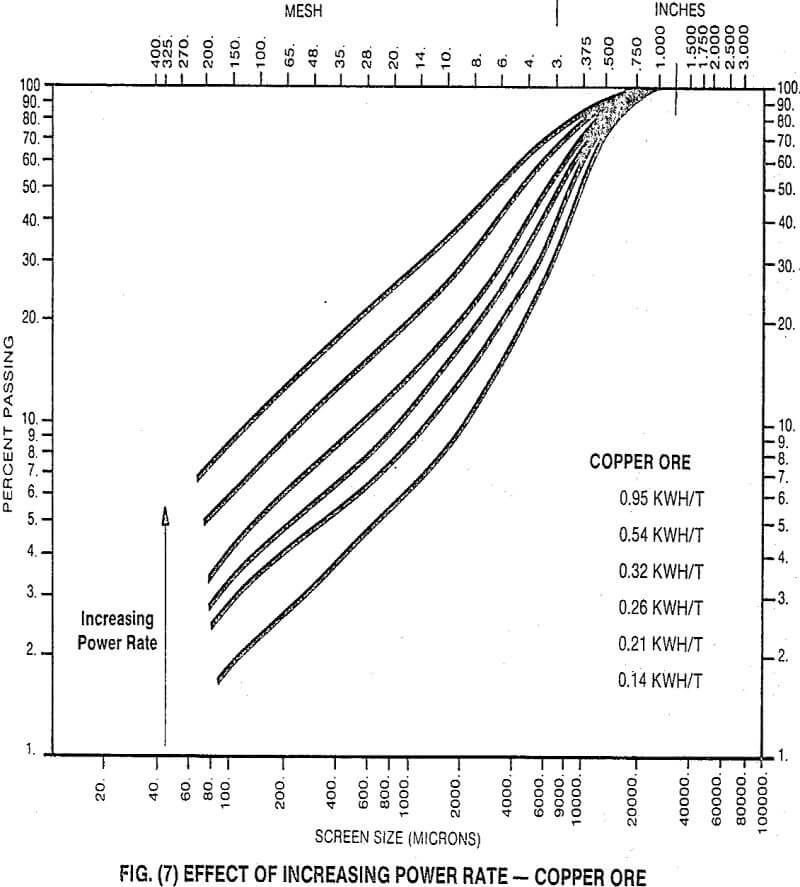
In order to show that the pendulum product size distribution is sensitive to power rate, several tests have been run on the same feed material at different levels of pendulum input energy. Typical results are shown in Fig. (7) as Schuhmann size distribution (log-log) plots. It can be seen that increasing amounts of fine material are produced with increasing energy input. The same effect was previously demonstrated for an operating crusher in Fig. (1). We can, therefore, conclude from this
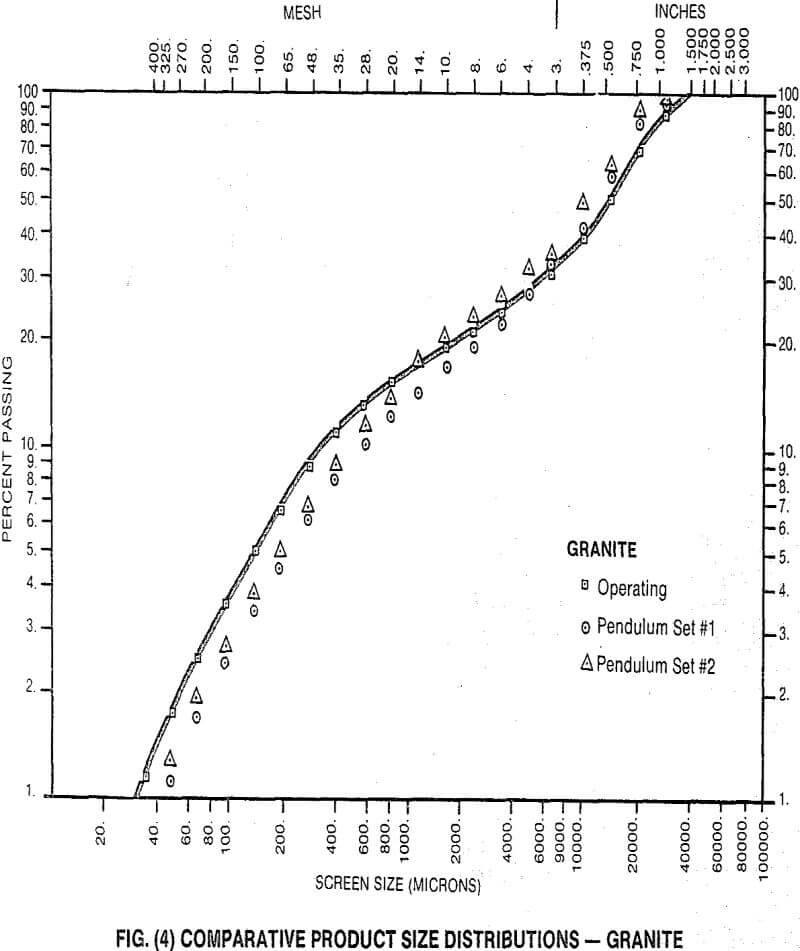
that net power rates will be the same in the pendulum and the crusher when the two distributions coincide (as they do in Figs. (4) thru (6). This permits us to determine the efficiency of power utilization in crushers and to predict the product size distribution which will arise from operating crushers at different power rates.
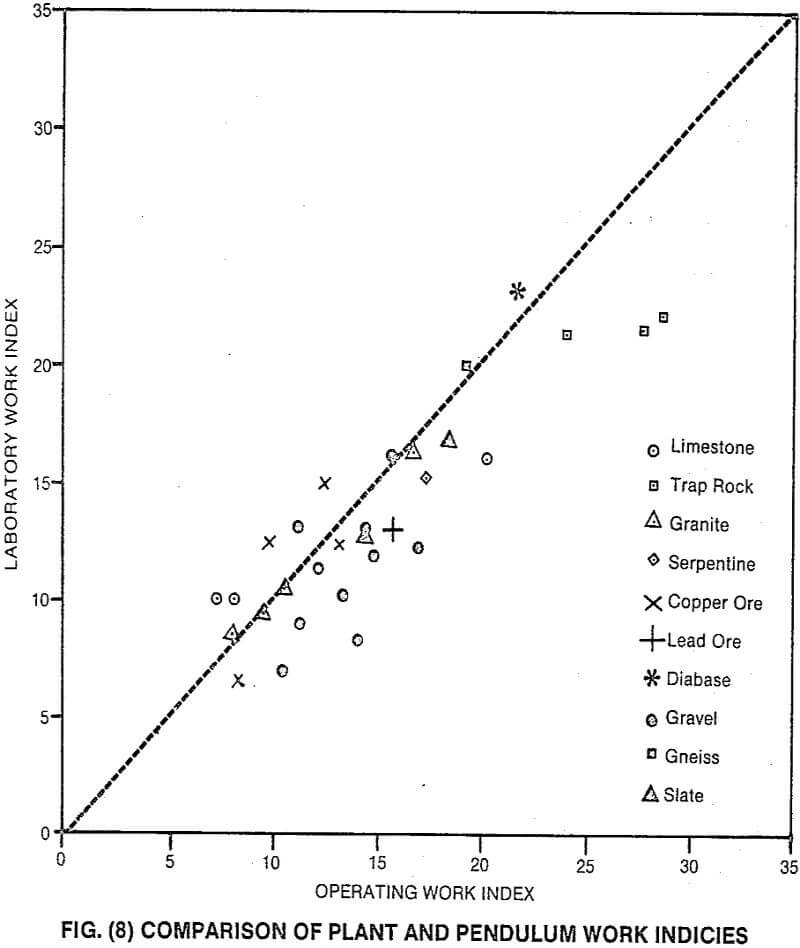
The Bond Work Index figures obtained by backcalculation from the pendulum data are compared with the Net Work Index values obtained from the plants in Fig. (8). The agreement is surprisingly good especially in view of the fact that the 80% passing values do not completely describe the total feed arid product size distributions. This agreement is probably due to the fact that the use of comparable energy levels in both machines gives rise to similar reduction ratios and product size distributions. Because of this, the pendulum test provides a good estimate of the Net Work Index when this is required for current design procedures.
The pendulum product distribution is a breakage function and can be used in models of the process to predict crusher product distributions for different operating conditions. As an example of this approach, Whiten’s model of the cone crusher, Fig. (9), has been used to simulate the situation given in Fig. (4). The result of this simulation is given in Fig. (10) where it can be seen that very good approximations of crusher performance can be obtained.
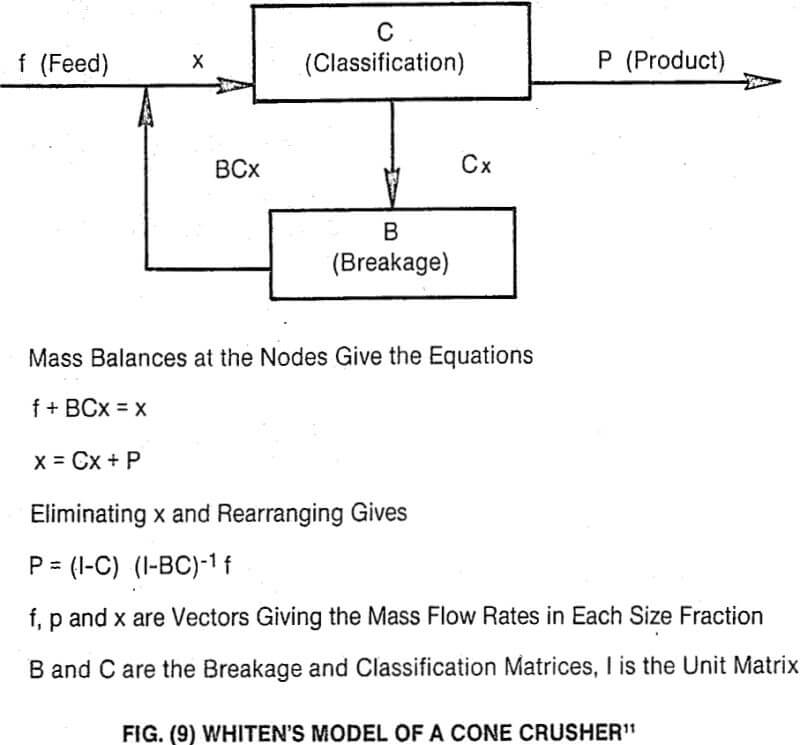
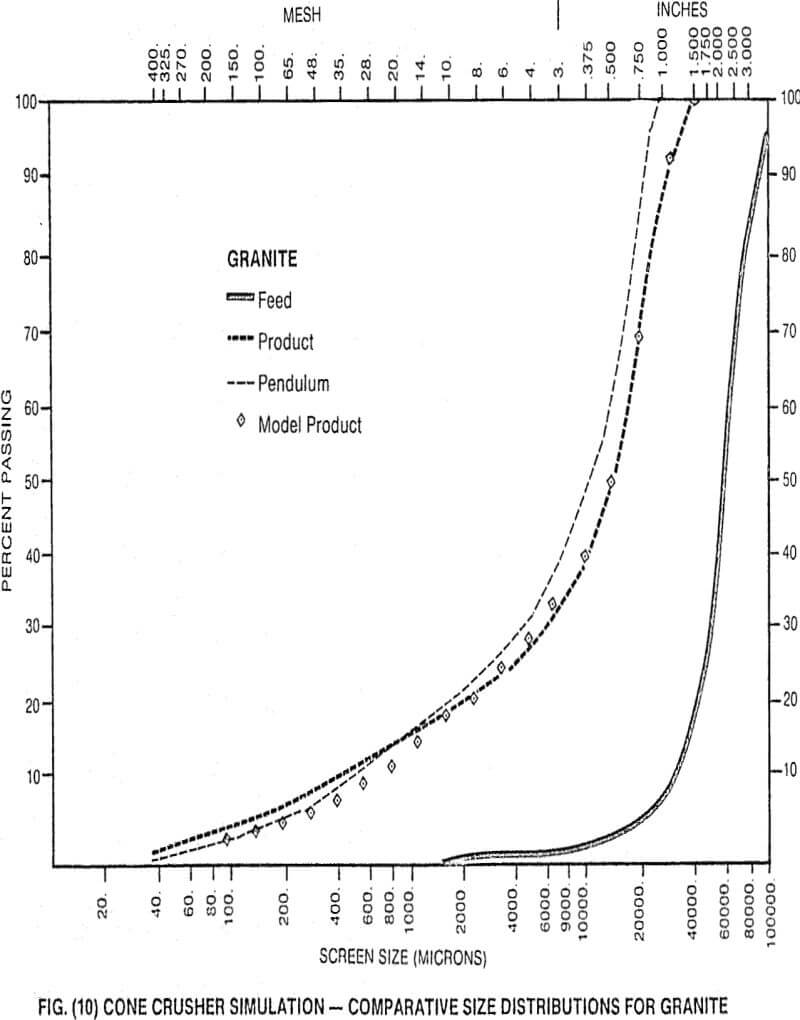
The selection (or classification) function used in this simulation was determined by backcalculation. Work is presently underway to quantify this function.
The writers are firmly of the opinion that results to date prove that the use of this pendulum device can give more energy-size reduction information in a form readily useable for crusher application. The data can be generated in less time and from a much smaller sample than is required for pilot plant testing. Our present pendulum tester is a research tool and is currently being modified for use in commercial testing of minerals and rocks. More details of this device will be given at a later date.